Harmonic Patterns in Trading
Trading in the financial markets involves a deep understanding of various strategies and techniques to predict the future direction of asset prices. One such technique is the use of harmonic patterns. This article will delve into the concept of harmonic patterns, their types, and how traders use them to make informed trading decisions.
What are Harmonic Patterns?
Harmonic patterns in trading are precise, geometric price structures that combine Fibonacci number sequences and market geometry to identify potential reversal points in the financial markets. These patterns were discovered by H.M. Gartley in 1932 and have been used by traders ever since to predict potential future market movements.
The Importance of Harmonic Patterns in Trading
Harmonic patterns are an essential tool for traders as they provide specific and objective price levels for potential entry, stop loss, and profit targets. They are particularly useful in identifying potential reversal points, helping traders to enter or exit a position at the most opportune moment.
Types of Harmonic Patterns
There are several types of harmonic patterns that traders use to predict price movements. These include the Gartley pattern, the Butterfly pattern, the Bat pattern, and the Crab pattern.
The Gartley Pattern
The Gartley pattern, named after its founder, is one of the most commonly used harmonic patterns. It is a four-point retracement structure that follows specific Fibonacci ratios.
The Butterfly Pattern
The Butterfly pattern is similar to the Gartley pattern but has a different Fibonacci structure. It was discovered by Bryce Gilmore and Larry Pesavento and is known for its high probability of success.
The Bat Pattern
The Bat pattern, discovered by Scott Carney, is another harmonic pattern that uses Fibonacci ratios to identify potential reversal points. It is known for its high accuracy rate.
The Crab Pattern
The Crab pattern is a five-point extension structure discovered by Scott Carney. It uses Fibonacci ratios to predict potential price reversals.
How Traders Use Harmonic Patterns
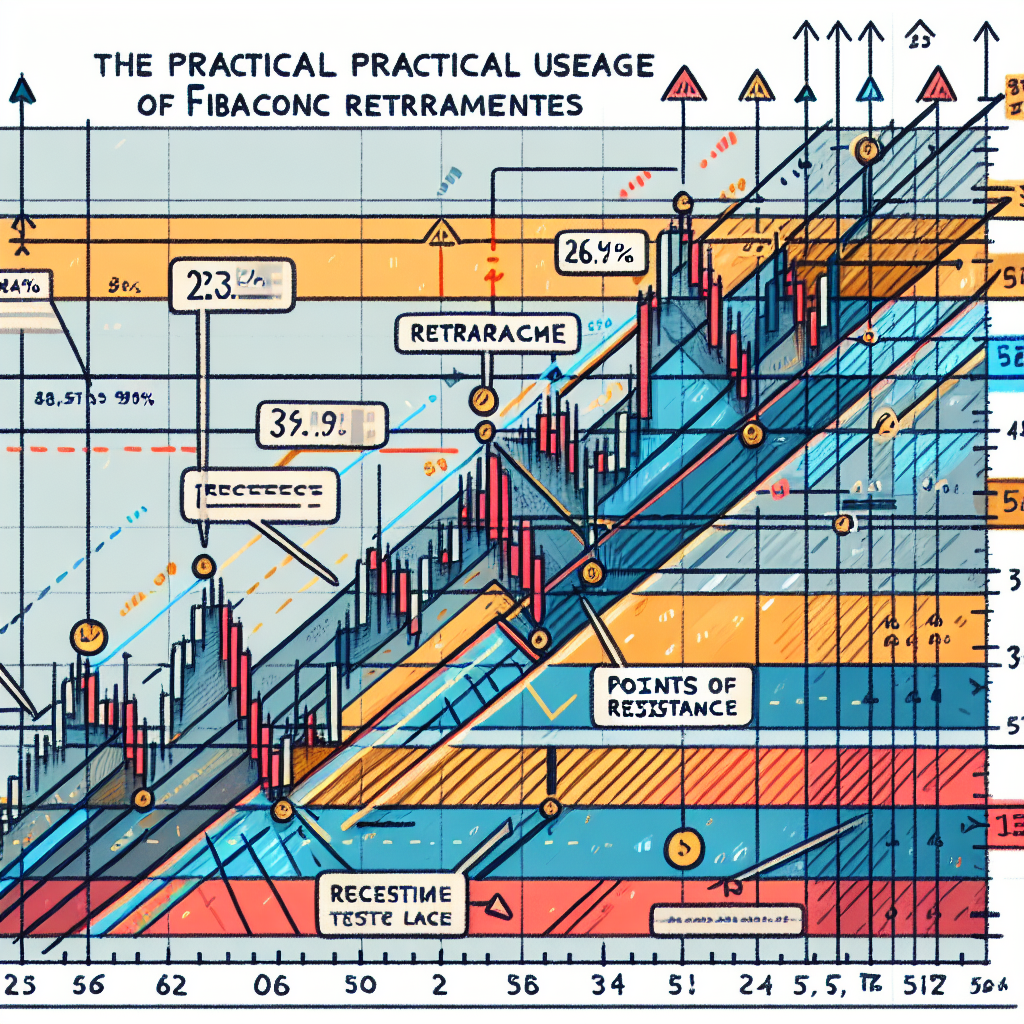
Traders use harmonic patterns by identifying these structures on their price charts. Once a pattern is identified, traders use the Fibonacci ratios within the pattern to determine potential price targets.
For example, if a trader identifies a Gartley pattern on their chart, they would look for a potential reversal at the completion of the pattern. They would then use the Fibonacci ratios within the pattern to identify potential entry and exit points.
Conclusion
Harmonic patterns are a powerful tool in a trader’s arsenal. They provide precise, objective, and high-probability trading opportunities in the financial markets. However, like all trading strategies, they require practice and experience to use effectively. Traders should spend time learning about these patterns and practicing identifying them on their charts before using them in live trading.


