Introduction to Elliott Wave Forecasting Models
Elliott Wave Theory is a technical analysis method that traders use to analyze market cycles and forecast market trends by identifying extremes in investor psychology, highs and lows in prices, and other collective factors. Named after its creator Ralph Nelson Elliott, this method was developed in the late 1930s. Elliott believed that stock markets, generally thought to behave in a somewhat random and chaotic manner, in fact, traded in repetitive cycles.
Understanding the Basics of Elliott Wave Theory
The Elliott Wave Theory asserts that crowd behavior ebbs and flows in clear trends. According to Elliott, these market trends result from investors’ reactions to external influences, or predominant psychology of the masses at the time. He found that the upward and downward swings of the mass psychology always showed up in the same repetitive patterns, which were then divided further into patterns he termed “waves”.
The Basic Wave Pattern
Elliott’s wave theory asserts that market trends unfold in specific patterns, or “waves,”. The most basic form of this pattern is a sequence of five waves. This includes three in the direction of the trend, interspersed by two corrections, often forming a ‘5-3’ move. The ‘5-3’ move then becomes two subdivisions of the next higher wave move.
The Wave Degrees
Elliott also discovered that in price terms, wave patterns exist in degrees of trend. This can range from grand supercycle (lasting several centuries) to sub-minuette (lasting a few minutes). Each degree of a pattern in a financial market has its characteristic, which reflects the mass psychology of the time.
The Application of Elliott Wave Forecasting Models
Today, traders apply the Elliott Wave theory to collectively analyze market trends and forecast future trends. They use it to identify market cycle stages, key market levels, investment risk levels, and the overall health of the underlying trend.
Identifying Market Cycle Stages
Traders use Elliott Wave forecasting models to identify the stages of a market cycle. By understanding the wave patterns, traders can anticipate what comes next, thus providing them with a kind of roadmap to future market activity.
Determining Key Market Levels
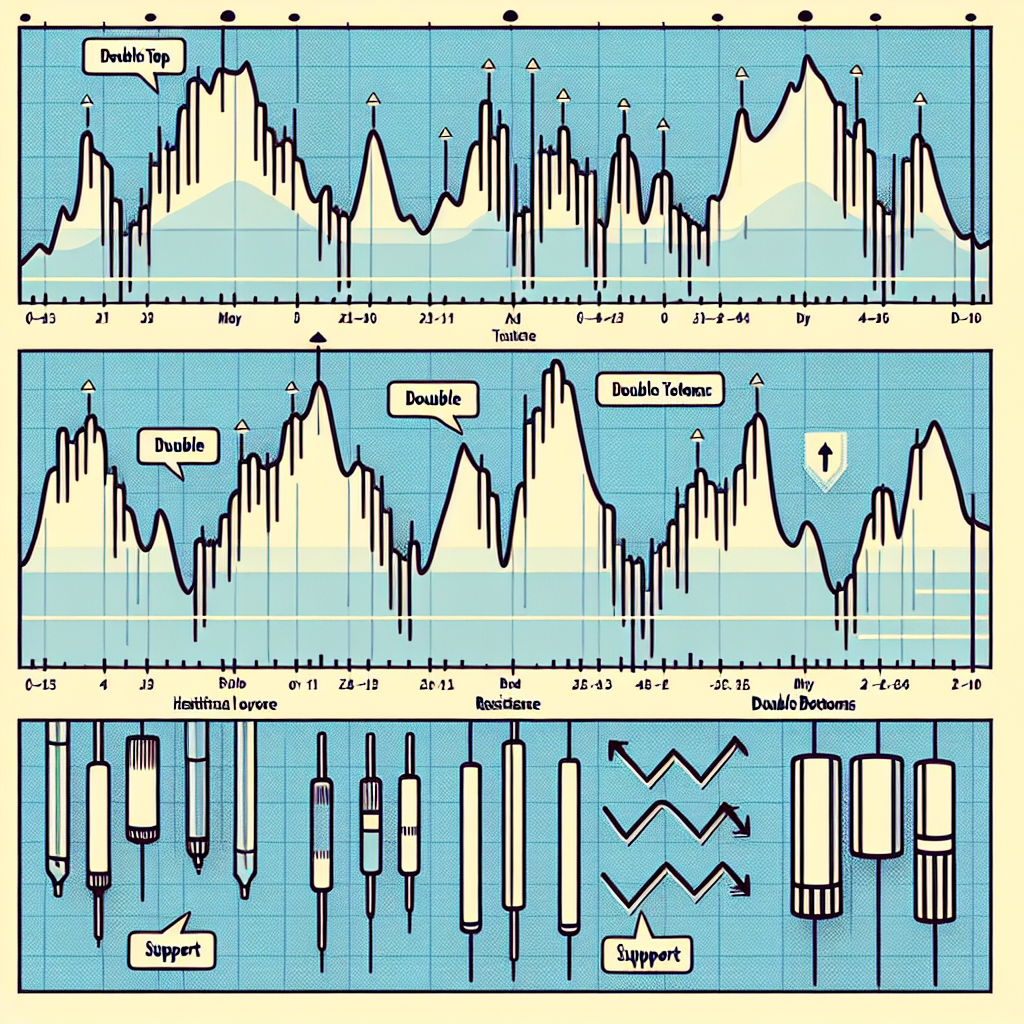
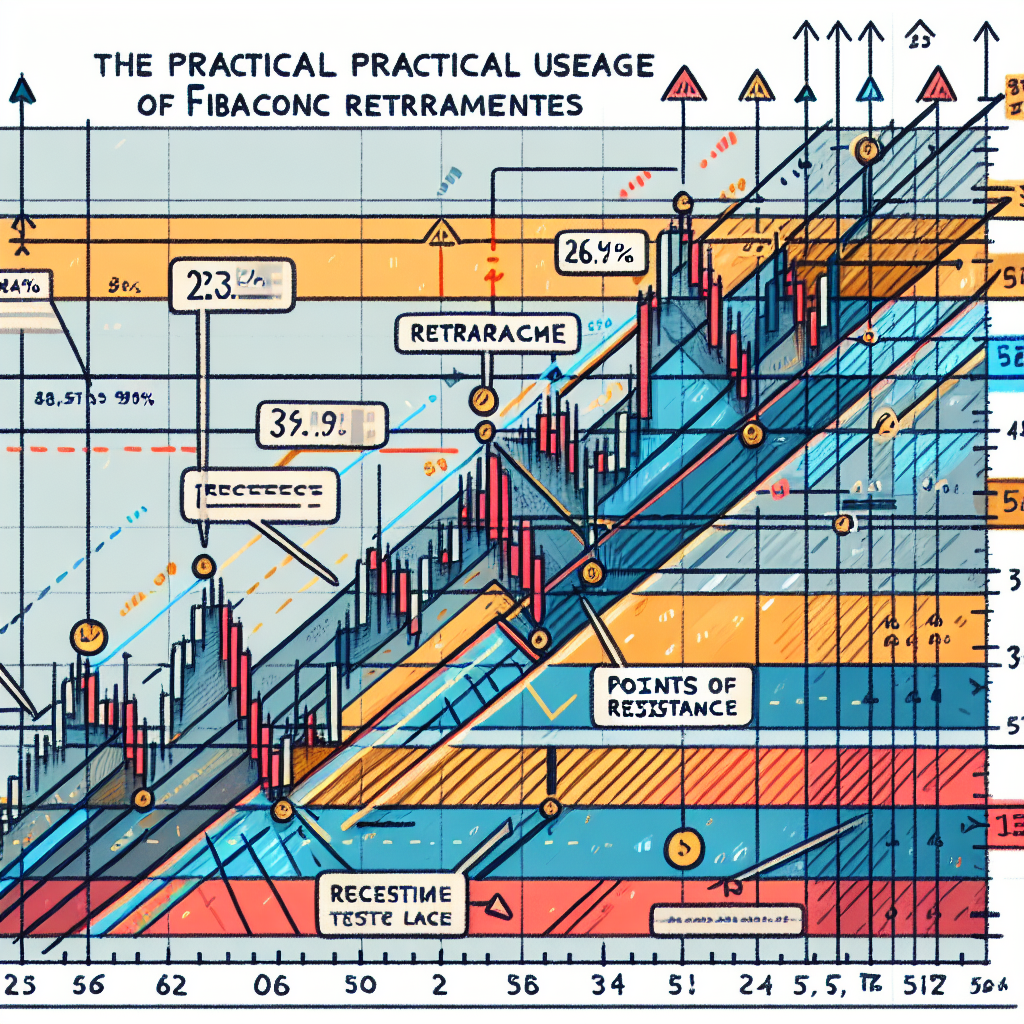
Elliott Wave models can also help traders determine key market levels, such as support and resistance. These levels often serve as critical turning points in the market and knowing where they lie can give traders a significant advantage.
Assessing Investment Risk Levels
The Elliott Wave theory can also be used to assess investment risk levels. By understanding where the market is in its wave cycle, traders can make more informed decisions about when to enter or exit a trade, thereby managing their risk more effectively.
Evaluating the Health of the Underlying Trend
Finally, Elliott Wave models can help traders evaluate the health of the underlying trend. This can be particularly useful in volatile markets, where it can be difficult to determine whether a particular movement represents a change in trend or simply a temporary correction.
Conclusion
Elliott Wave forecasting models provide a comprehensive way to view market patterns and forecast future trends. While they require a considerable amount of practice and experience to use effectively, they can be an invaluable tool for traders looking to understand market cycles and make more informed trading decisions.


