Introduction to Elliott Wave Analysis
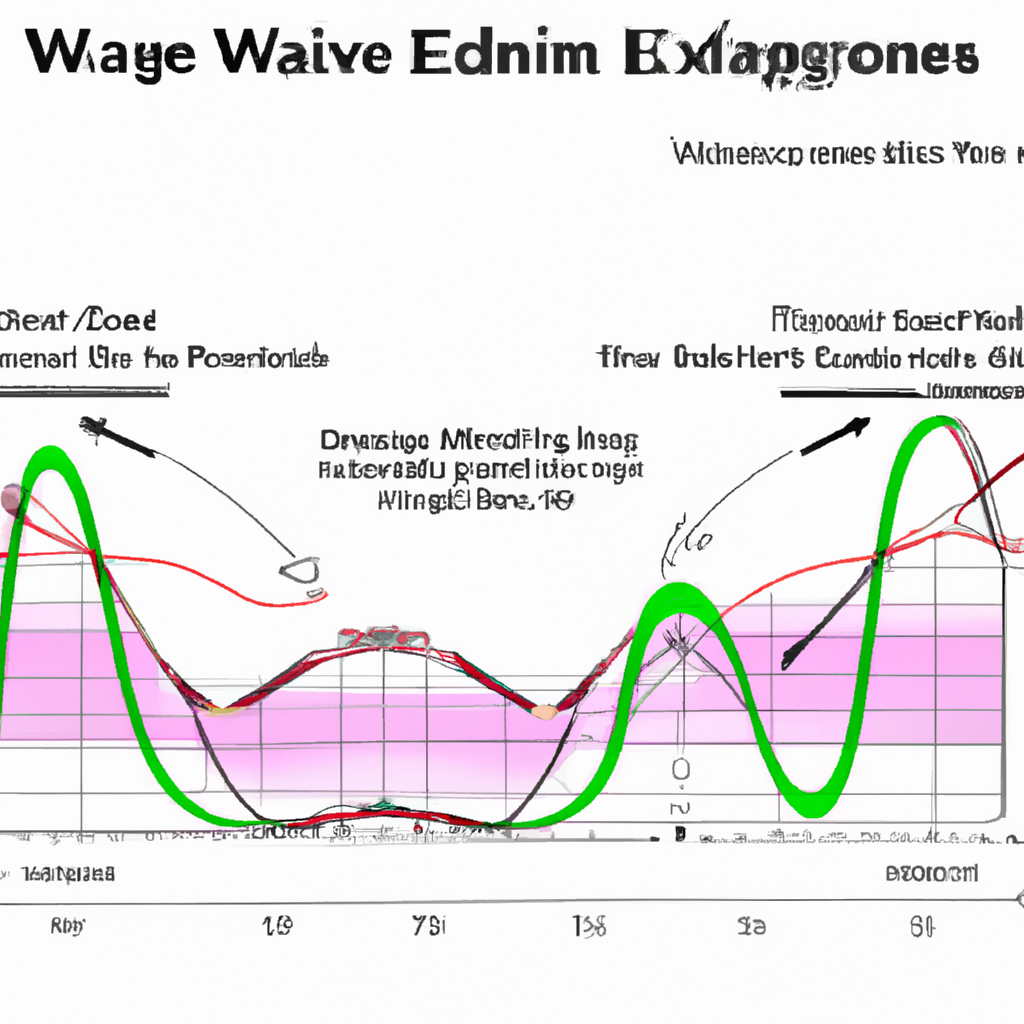
Elliott Wave Analysis is a technical analysis method that traders use to analyze market trends by identifying extremes in investor psychology, highs and lows in prices, and other collective factors. The theory was developed by Ralph Nelson Elliott in the late 1920s, and it suggests that the market moves in repetitive cycles, which he termed as waves. Each wave can provide information about the potential future price action.
Understanding the Elliott Wave Principle
The Elliott Wave Principle posits that collective investor psychology, or crowd psychology, moves between optimism and pessimism in natural sequences. These mood swings create patterns that can be seen in the price movements of markets at every degree of trend or time scale.
Elliott’s theory somewhat aligns with the Dow theory in that both recognize that stock prices move in waves. However, Elliott was able to break down and analyze these movements in much greater detail.
Impulse Waves and Corrective Waves
Elliott identified a specific structure to these price movements in the market. This structure consists of a five-wave cycle (called impulse waves) followed by a three-wave cycle (called corrective waves).
The five-wave cycle includes three waves moving in the direction of the main trend (waves 1, 3, and 5), interspersed with two corrections (waves 2 and 4). The three-wave cycle includes one wave moving against the trend (wave A), followed by one in the direction of the trend (wave B), and another one against the trend (wave C).
Applying Elliott Wave Analysis
Elliott Wave Analysis can be applied to any liquid financial market. This includes stock markets, forex, commodities, and even cryptocurrencies. Traders can use this method to identify high probability setups, predict future price movements, and manage risk.
Identifying the Wave Count
The first step in applying the Elliott Wave Analysis is identifying the wave count. This involves identifying the start of a wave, usually a significant high or low, and counting the subsequent waves. This step requires practice and experience, as correctly identifying the wave count can be complex.
Applying Fibonacci Ratios
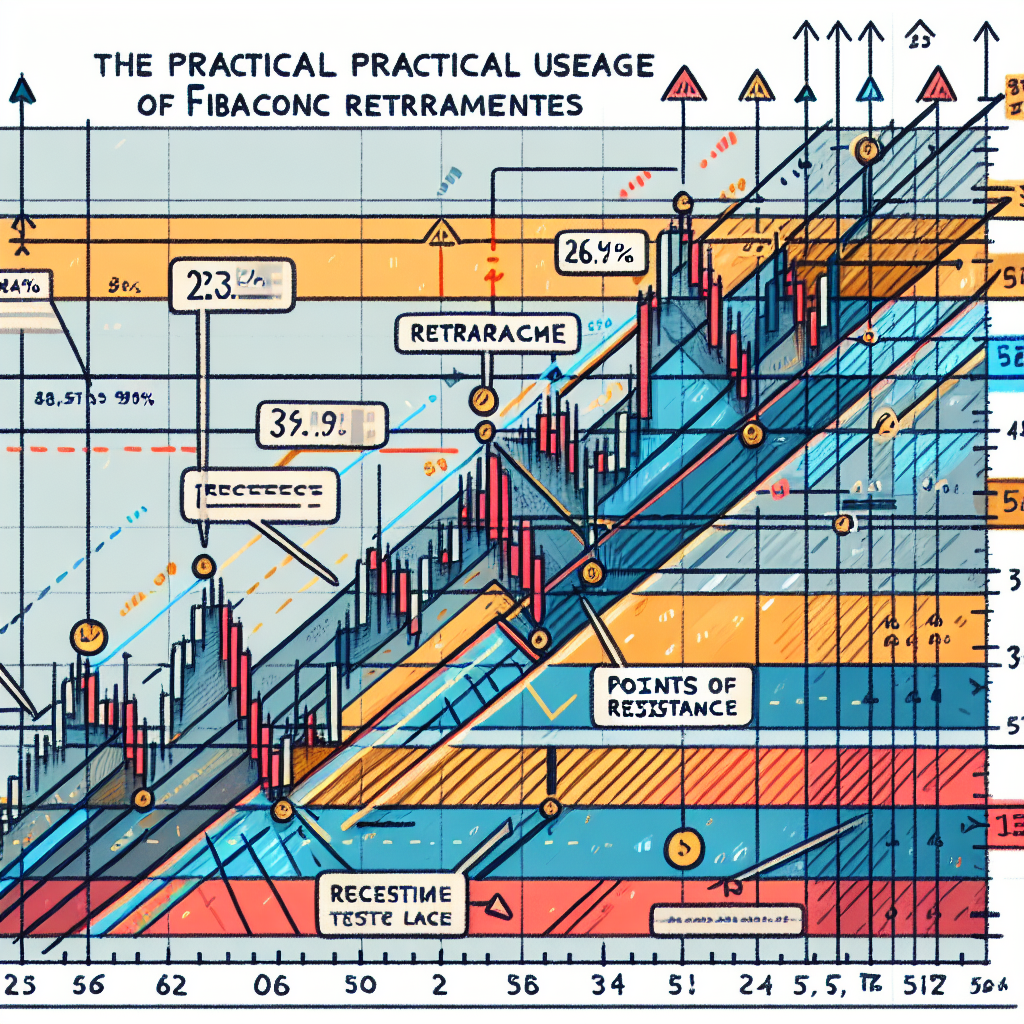
Elliott discovered that the waves often relate to each other in terms of Fibonacci ratios. For example, wave 3 is often 1.618 times the length of wave 1, and wave 2 often retraces 0.618 times of wave 1. Traders often use these ratios to predict the end of waves and to set trade targets.
Using Elliott Wave for Risk Management
One of the key aspects of trading is risk management, and Elliott Wave Analysis can be a useful tool for this. If the market does not follow the predicted wave count, it may be a signal that the trader’s analysis is wrong. This can help traders to quickly exit a losing trade and minimize losses.
Conclusion
Elliott Wave Analysis is a powerful tool for traders, offering insights into market trends and potential future price movements. However, like any trading method, it requires practice and experience to use effectively. As always, traders should use this method in conjunction with other tools and strategies to increase their chances of success.


