# Understanding Trend Line Drawing Methods
Trend lines are a fundamental tool in technical analysis for both stock and forex trading. By identifying the direction of market trends, traders can make informed decisions about entry and exit points, thus maximizing their potential for profit. This article explores various methods for drawing trend lines, ensuring that even beginners can grasp how to efficiently utilize this powerful tool.
##
Introduction to Trend Lines
At their core, trend lines connect a series of prices together, revealing the underlying direction or trend of a market. A trend can be upward (bullish), downward (bearish), or sideways (neutral). By drawing trend lines directly on charts, traders visually ascertain where the market is heading, which aids in their trading strategy.
##
Methods of Drawing Trend Lines
There are several methods for drawing trend lines, each with its own set of rules and applications. Choosing the right method depends on your trading strategy, the market condition, and personal preference.
###
Basic Trend Line Drawing
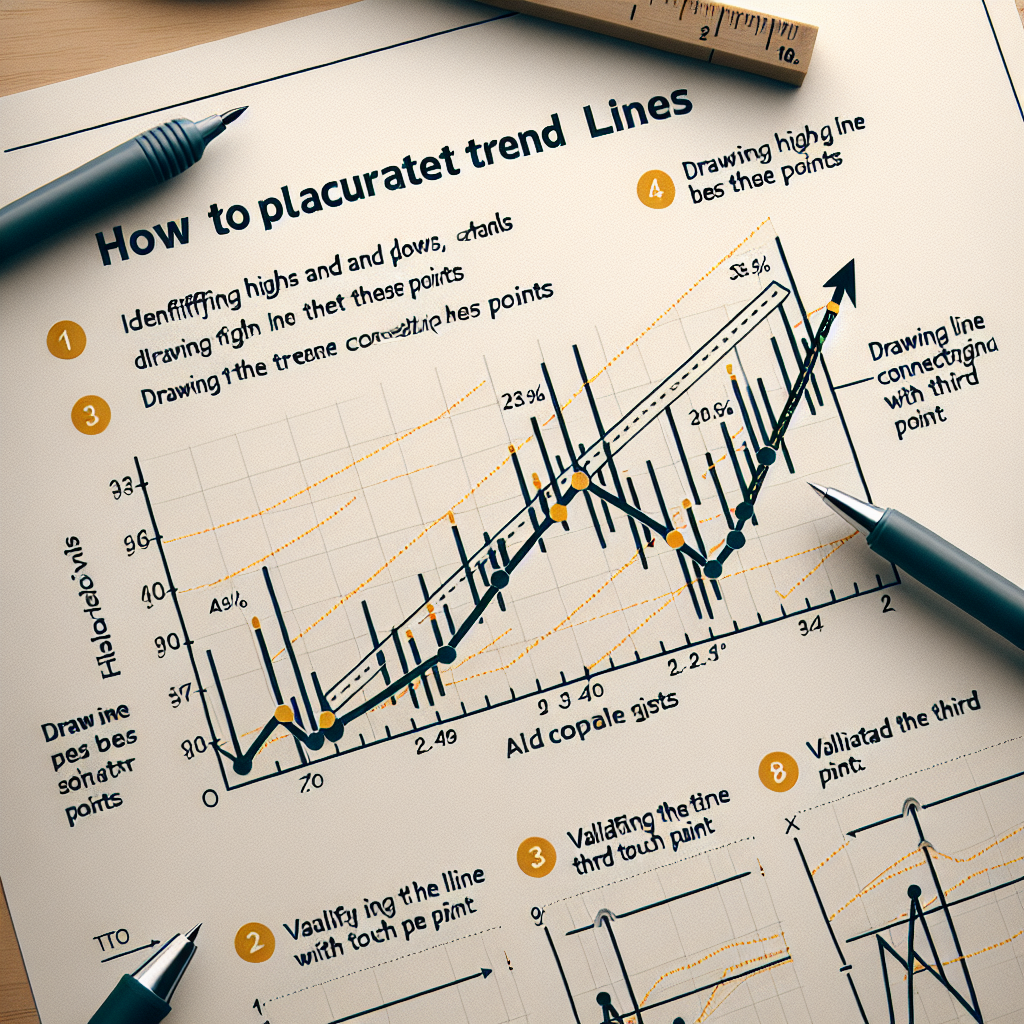
The simplest way to draw a trend line is by connecting two or more lows in an uptrend, or two or more highs in a downtrend. The key is to ensure that the line touches the most possible points without cutting through the body of a candlestick. This method is straightforward and widely used, making it an excellent starting point for beginners.
1. **Identify the trend**: Determine whether the market is in an upward, downward, or sideways trend.
2. **Select points**: For an uptrend, choose the lowest points (troughs). For a downtrend, select the highest points (peaks).
3. **Draw the line**: Connect these points with a straight line. This line should touch at least two points, but more contacts increase its significance.
###
Channel Trend Lines
Channel trend lines involve drawing two parallel lines to encapsulate the price movement of a security. One line is drawn at the peaks, and another at the troughs, creating a channel.
1. **Draw the first line**: Follow the steps for the basic trend line method.
2. **Copy and paste**: Once the primary trend line is established, copy and paste it to the opposite side of the trend.
3. **Adjust the second line**: Position the second line so that it runs parallel to the first, touching either the highs or lows, creating a channel.
###
Using Moving Averages
Although not a traditional method of drawing trend lines, using moving averages can provide a dynamic representation of trend direction. Moving averages smooth out price data to form a line that follows the trend.
1. **Select a moving average**: Choose the type (simple, exponential) and period (e.g., 50-day, 200-day) of the moving average.
2. **Apply it to the chart**: The moving average line will automatically adjust and draw itself across the price chart.
3. **Interpret the trend**: An upward-sloping moving average indicates an uptrend, while a downward slope suggests a downtrend. A flattening line implies a potential change in trend direction.
##
Best Practices for Drawing Trend Lines
Drawing trend lines might seem simple, but accuracy is crucial for effective application. Here are some best practices to consider:
– **Use a clean chart**: Avoid clutter with too many indicators, as they can obscure trend line visibility.
– **Connect significant points**: Focus on prominent highs and lows for a more reliable trend line.
– **Stay flexible**: Be prepared to adjust your trend lines as new price data becomes available.
– **Look for confirmation**: A trend is more reliable if confirmed by trading volume or other indicators.
##
Conclusion
While the concept of trend lines is straightforward, mastering their use takes practice and patience. By starting with the basic methods outlined above and adhering to best practices, you can enhance your technical analysis skills. As you become more experienced, experiment with different methods and tools to find what works best for your trading strategy. Remember, no technique is infallible, so always consider using trend lines as part of a broader, diversified trading approach.