Understanding Support and Resistance Level Strategies in Trading
Trading in financial markets involves a lot of analysis and strategy. One of the most commonly used techniques by experienced traders is the support and resistance level strategy. This article aims to explain what these levels are, how they are identified, and how they can be used to make informed trading decisions.
What are Support and Resistance Levels?
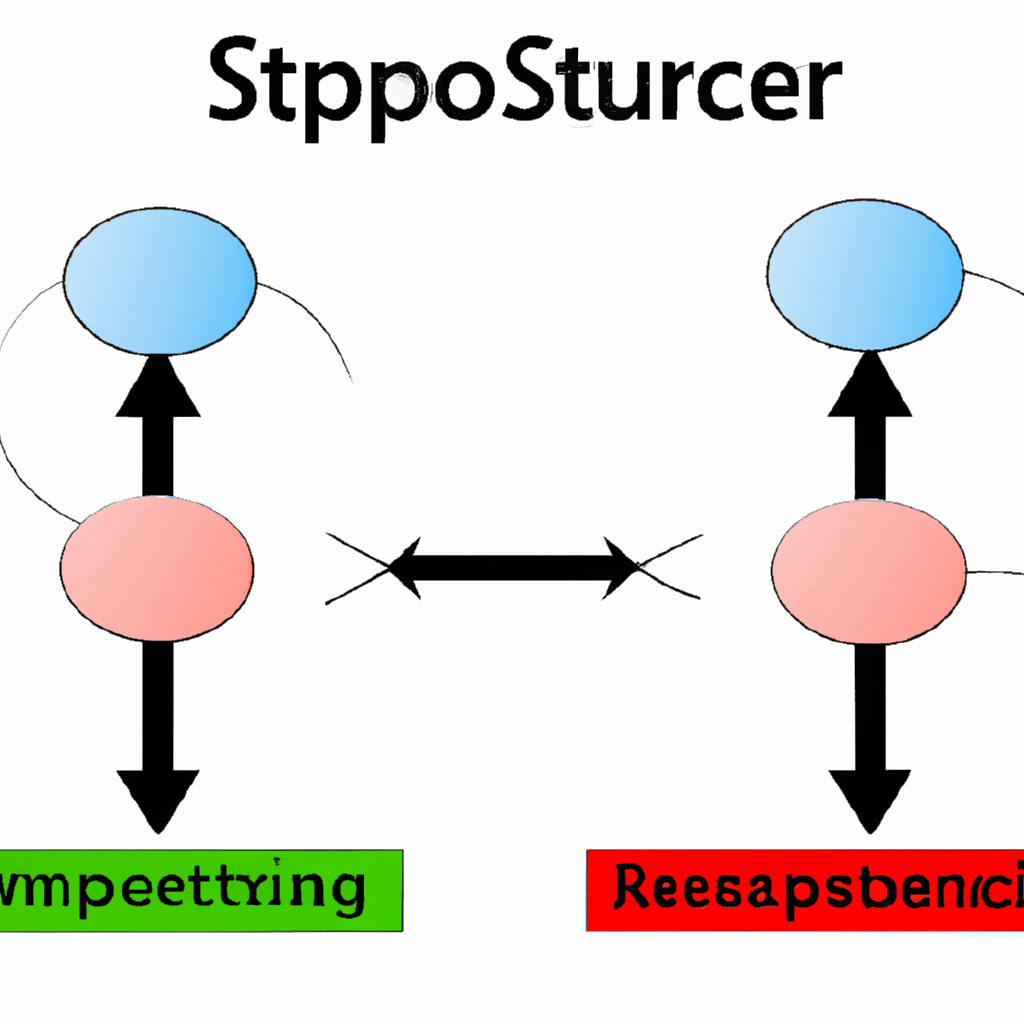
Support and resistance levels are two of the most fundamental concepts in technical analysis of financial markets. They represent the points on a chart where the probabilities favor a pause or reversal of a prevailing trend.
Support Level
A support level refers to the price level which an asset does not often fall below due to more buyers being interested in it at that price. In other words, this is the level at which demand is strong enough to prevent the price from declining further.
Resistance Level
On the other hand, a resistance level refers to the price level that an asset does not often surpass due to more sellers being interested in it at that price. This is the level at which supply is strong enough to prevent the price from rising further.
Identifying Support and Resistance Levels
Identifying support and resistance levels is a crucial part of implementing this strategy. These levels are usually identified by studying historical price data and chart patterns.
Historical Price Data
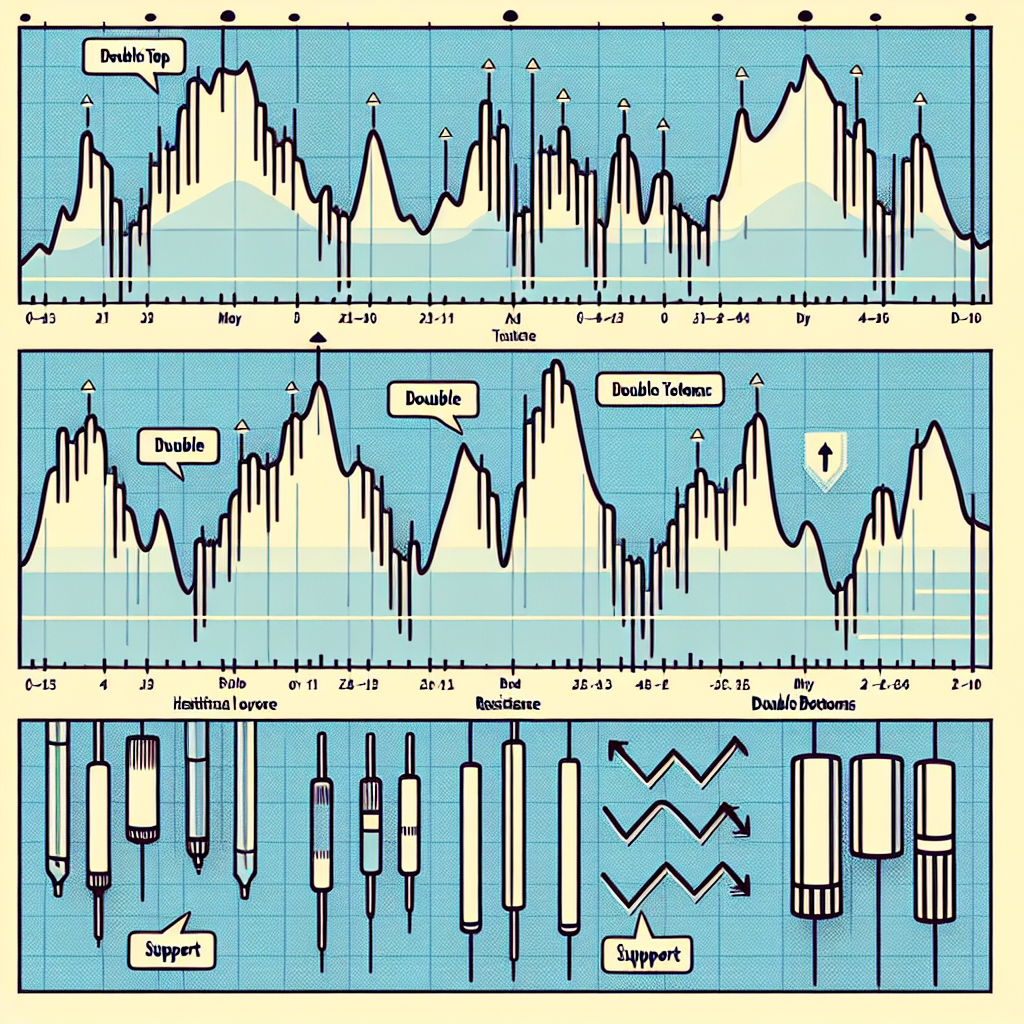
By looking at historical price data, traders can identify price levels where a large amount of buying or selling action has occurred in the past. These levels are likely to be significant in terms of support and resistance.
Chart Patterns
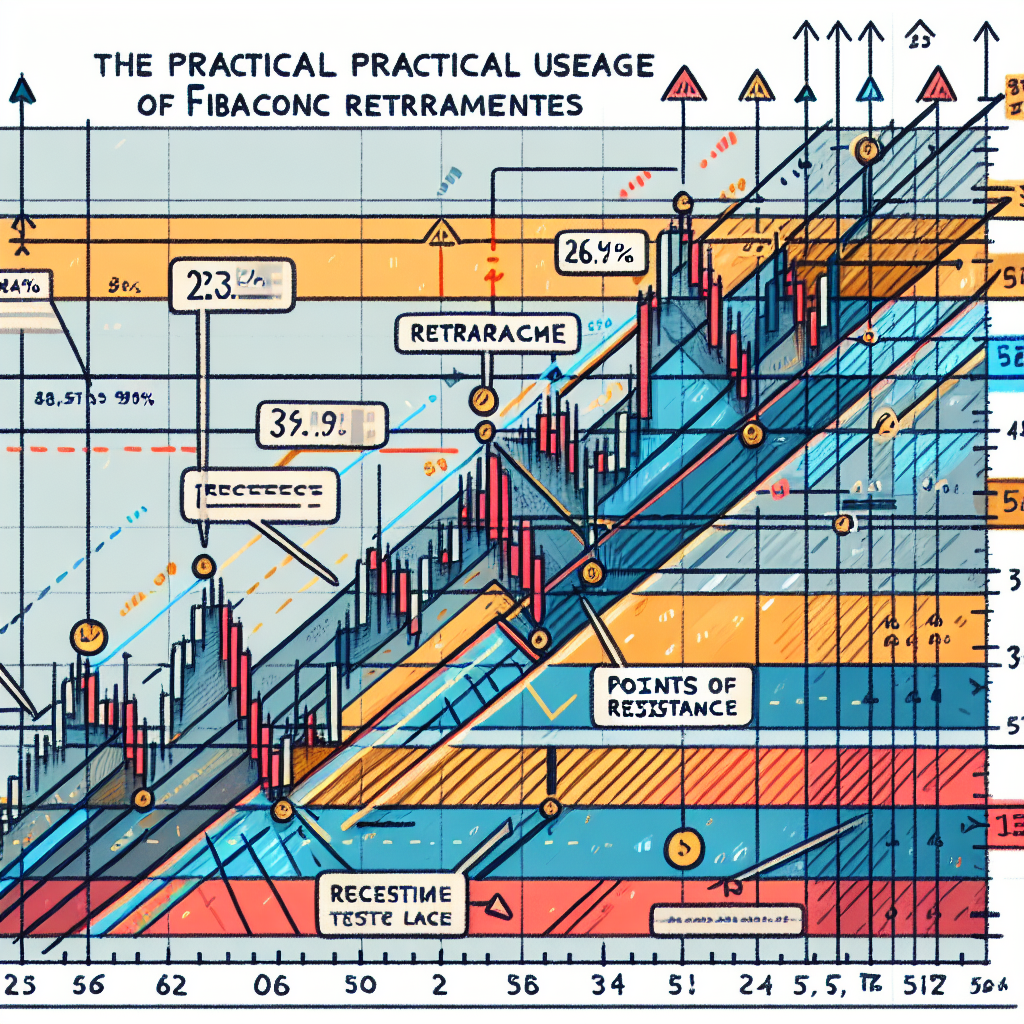
Chart patterns, such as trend lines, channels, or Fibonacci retracements, can also provide clues about potential support and resistance levels. These patterns can show areas where the price has bounced back in the past, indicating potential levels of support or resistance.
Using Support and Resistance Levels in Trading
Once support and resistance levels have been identified, they can be used to make informed trading decisions. Here’s how:
Buying at Support Levels
When the price of an asset falls towards a support level, it is a common strategy to consider buying. This is based on the expectation that the price will bounce back up from the support level, just as it has in the past.
Selling at Resistance Levels
Similarly, when the price of an asset rises towards a resistance level, it is a common strategy to consider selling. This is based on the expectation that the price will bounce back down from the resistance level, just as it has in the past.
Breakouts
Sometimes, the price of an asset can break through a support or resistance level. This is known as a breakout. Breakouts can signal a significant change in supply or demand and can potentially lead to large price movements. Traders often use breakouts as signals to enter trades.
In conclusion, understanding support and resistance levels is a vital part of technical analysis and trading. By correctly identifying these levels, traders can make more informed decisions and potentially increase their chances of success.


