Introduction to Fibonacci Extensions in Trading
In the realm of technical analysis, Fibonacci extensions are a popular tool among traders. They are used to predict future price levels by analyzing previous price movement patterns. The Fibonacci extension is based on the mathematical Fibonacci sequence, where each number is the sum of the two preceding ones, starting from 0 and 1.
Understanding Fibonacci Extensions
Fibonacci extensions are ratios used in Fibonacci retracement to forecast areas of support or resistance. They are derived from the mathematical relationships between the numbers in the Fibonacci sequence, which run as follows: 0, 1, 1, 2, 3, 5, 8, 13, 21, 34, and so on. The sequence extends to infinity and contains many unique mathematical properties.
The Fibonacci Ratios
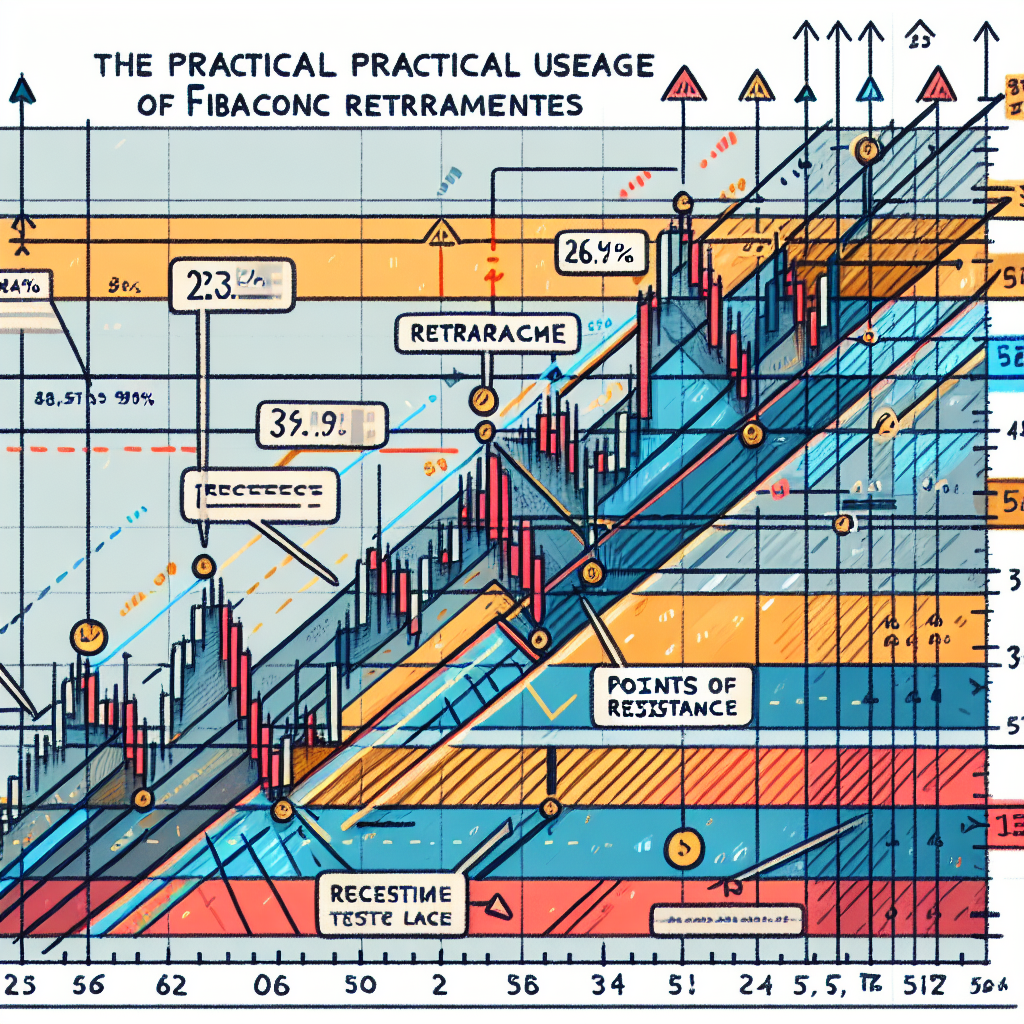
In trading, the primary ratios derived from this sequence are 0.618, 0.382, and 0.236. By dividing any number in the sequence by the number that follows it, you get approximately 0.618. Similarly, a division by the second following number gives approximately 0.382, and by the third following number, 0.236. These ratios are known as the Golden Mean and are universally applied in many areas, including trading.
How to Use Fibonacci Extensions in Trading
Fibonacci extensions are used to estimate the points where a price may change direction. To apply them, you need to identify the ‘swing high’ and ‘swing low’ points on a chart. The swing high is the highest point on the graph, usually at the end of an upward trend. The swing low, conversely, is the lowest point, often at the end of a downward trend.
Step 1: Identifying Swing High and Swing Low
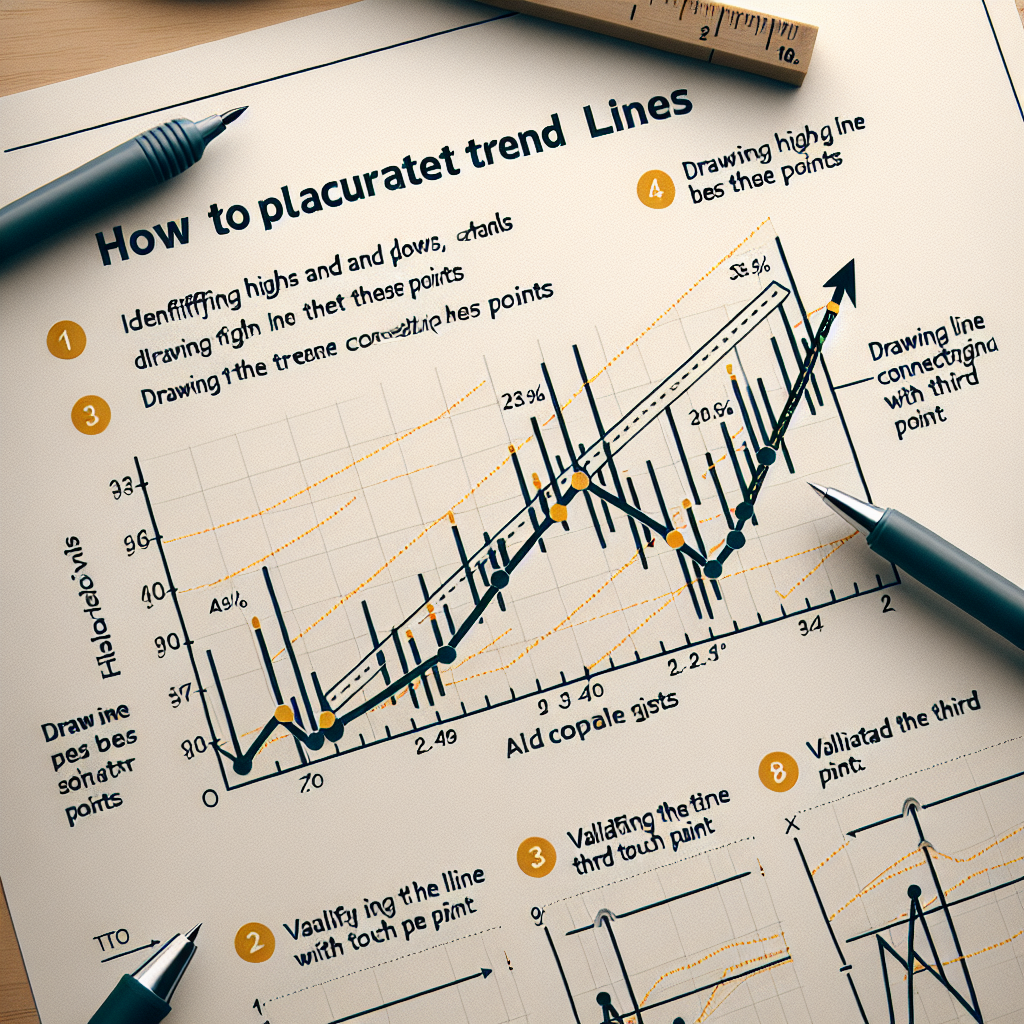
The first step is to identify the most recent swing high and swing low on the chart. The swing high is a candlestick at the peak of a trend with lower highs on either side, while the swing low is a candlestick at the trough of a trend with higher lows on either side.
Step 2: Applying the Fibonacci Extension Tool
Next, you apply the Fibonacci extension tool on your trading platform. You connect the swing low to the swing high if the trend is upward, and vice versa for a downward trend. Most trading platforms will automatically calculate the Fibonacci levels for you.
Step 3: Interpreting the Fibonacci Levels
After applying the Fibonacci extension, you’ll see horizontal lines intersecting with your price chart. These lines represent potential levels of support or resistance. Traders use these levels to help identify potential reversal points in the market.
Conclusion
Fibonacci extensions are a powerful tool in a trader’s arsenal, providing potential insights into future price movements. While they’re not guaranteed to predict market movements with 100% accuracy, they can certainly enhance your trading strategy when used in conjunction with other technical analysis tools. Remember, successful trading involves not only the use of effective tools but also disciplined risk management and a thorough understanding of the markets.


