Identifying Key Support and Resistance Zones in Trading
Trading in the financial markets involves a lot of analysis and interpretation of market trends. One of the fundamental aspects of technical analysis in trading is the identification of key support and resistance zones. These zones are crucial in predicting potential price movements and making informed trading decisions.
What are Support and Resistance Zones?
Before we delve into how to identify these zones, it’s essential to understand what they are.
Support Zones
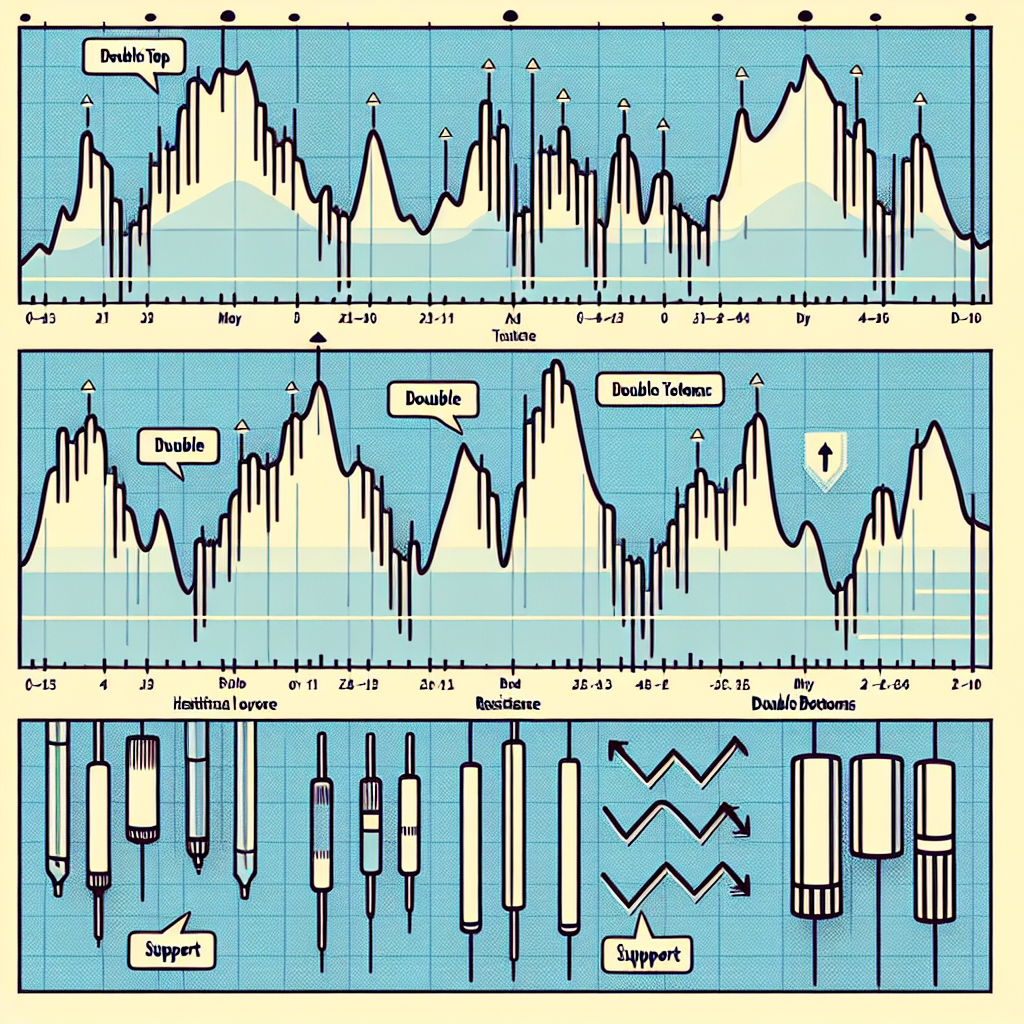
A support zone refers to the price level at which the price of a security tends to stop falling because demand is strong enough to prevent the price from decreasing further. In other words, it’s the level at which buyers tend to enter the market in large numbers, causing the price to rise.
Resistance Zones
On the other hand, a resistance zone is the price level at which the price of a security tends to stop rising because supply is strong enough to prevent the price from increasing further. It’s the level at which sellers tend to enter the market in large numbers, causing the price to fall.
Identifying Key Support and Resistance Zones
Identifying these zones can be subjective, as different traders might interpret charts differently. However, there are several techniques you can use to identify these critical areas more accurately.
1. Use of Historical Data
One of the simplest ways to identify key support and resistance zones is by looking at the historical price data of a security. Areas where the price has bounced off multiple times in the past can often act as future support or resistance zones.
2. Trend Lines
Trend lines, which connect lower lows or higher highs, can also help identify potential support or resistance zones. A rising trend line can act as support, while a falling trend line can act as resistance.
3. Moving Averages
Moving averages smooth out price data by creating a constantly updated average price, which can be taken as a support or resistance level. The most commonly used are the 50-day and 200-day moving averages.
4. Fibonacci Retracement Levels
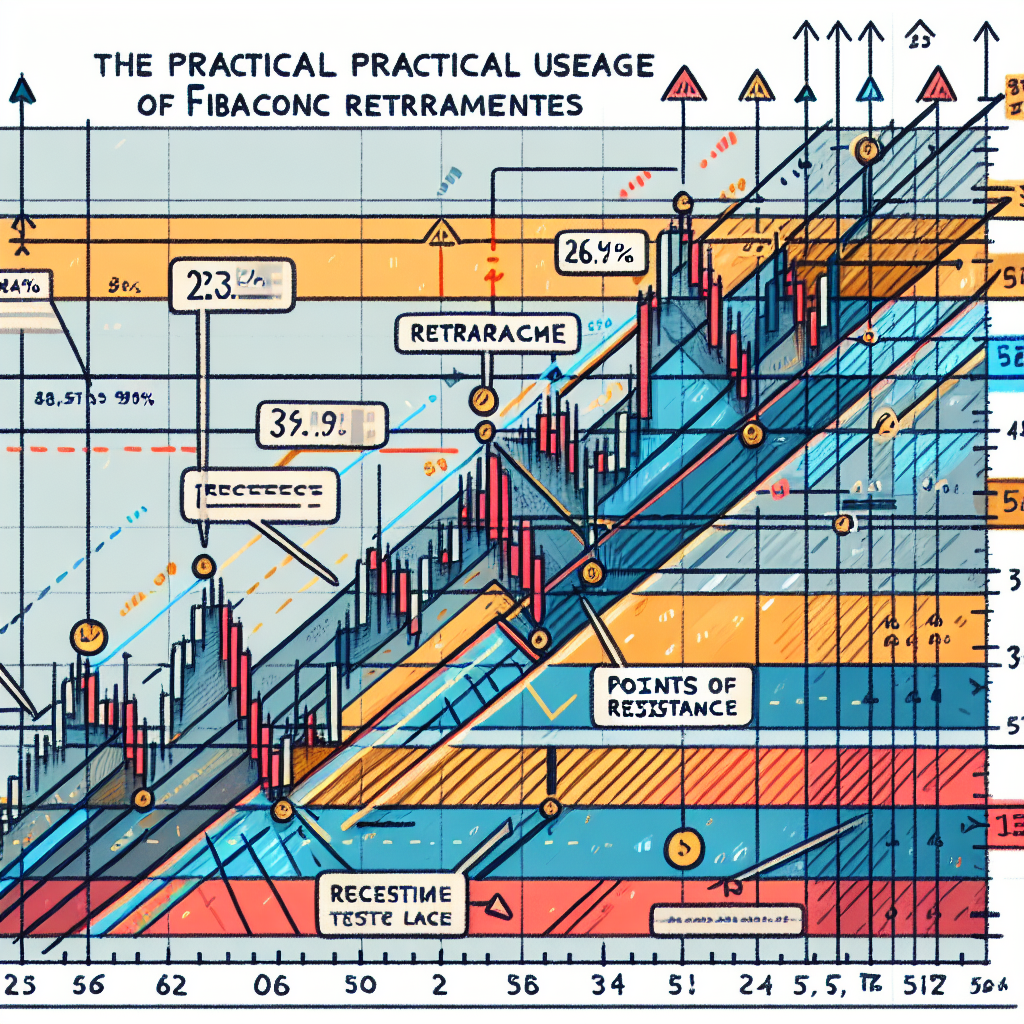
Fibonacci retracement levels are horizontal lines that indicate where potential support and resistance levels are likely to occur. They are calculated by taking two extreme points (a major peak and trough) on a stock chart and dividing the vertical distance by key Fibonacci ratios of 23.6%, 38.2%, 50%, 61.8%, and 100%.
Importance of Support and Resistance Zones
Understanding support and resistance zones is crucial for traders as these zones can help in making strategic trading decisions. They can provide clues about when to enter or exit a trade, set stop losses, or target price levels. Additionally, these zones can also provide insights into the psychology of the market, indicating areas of fear (support) and greed (resistance).
Conclusion
Identifying key support and resistance zones is an essential skill in technical analysis and trading. While it may seem daunting at first, with practice and patience, you can enhance your trading strategy and potentially increase your profitability in the market. Remember, the more times a support or resistance zone is tested and holds, the stronger it is considered to be.


