Identifying Common Chart Patterns
Trading and investing rely heavily on the ability to interpret chart patterns. Chart patterns are a fundamental aspect of technical analysis, providing traders with a visual representation of supply and demand. This article will guide you through some of the most common chart patterns and how to identify them.
What are Chart Patterns?
Chart patterns are graphical representations of price movements that follow a certain form recognized in technical analysis. These patterns are identified by a line connecting common price points, such as closing prices or highs or lows, over a specific period. They help traders and investors to anticipate what is “likely” to happen to prices over time.
Types of Chart Patterns
There are several types of chart patterns that traders and investors commonly use. These include continuation patterns, which suggest an ongoing trend will continue, and reversal patterns, which indicate a previous trend will reverse.
Continuation Patterns
Continuation patterns suggest that the ongoing trend will continue once the pattern is complete. They are often seen during a pause in the trend. The most common continuation patterns include triangles, flags, and pennants.
Triangles
Triangles are formed when the price action of an asset becomes less volatile over time, leading to the price bars getting smaller. There are three types of triangles: ascending, descending, and symmetrical.
Flags and Pennants
Flags and pennants are short-term continuation patterns that mark a small consolidation before the previous move resumes. These patterns are usually preceded by a sharp advance or decline with heavy volume, and mark a mid-point of the move.
Reversal Patterns
Reversal patterns are those chart formations that signal that the ongoing trend is about to change course. If a reversal chart pattern is seen during an uptrend, it indicates that the price might head down and vice versa. The most common reversal patterns include the head and shoulders, double tops and bottoms, and triple tops and bottoms.
Head and Shoulders
This pattern is one of the most reliable trend reversal patterns. It is made up of three peaks with the middle peak being the highest (the head) and the two others being roughly equal (the shoulders).
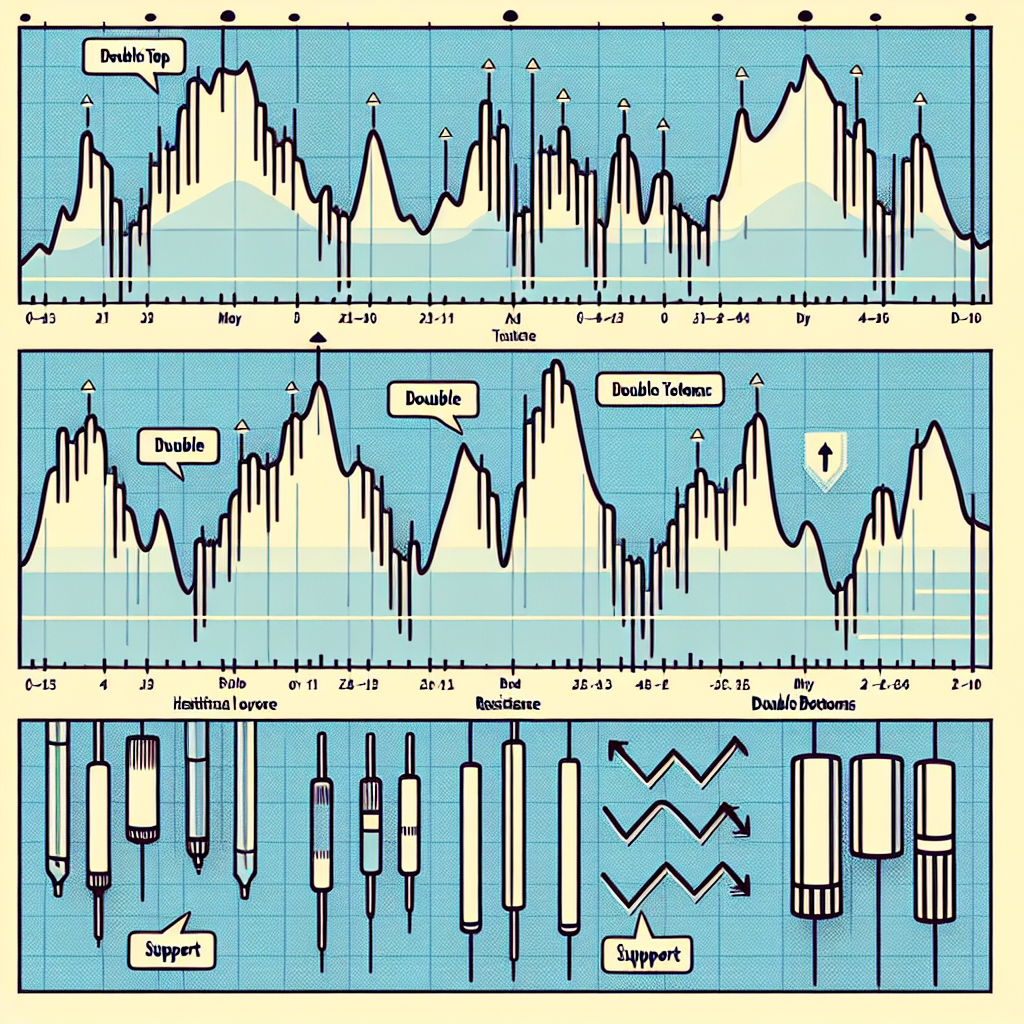
Double Tops and Bottoms
Double tops and bottoms are another common type of reversal pattern. They occur when the price moves in a pattern that resembles the letter “M” (double top) or “W” (double bottom).
Triple Tops and Bottoms
Triple tops and bottoms are similar to double tops and bottoms, but are considered to be more reliable due to their rarity. They occur when the price hits a level of resistance or support three times and is unable to break through.
Conclusion
Understanding and identifying common chart patterns can significantly improve your trading and investing decisions. While these patterns can provide a useful indication of future price movements, they should not be used in isolation. Always consider other factors such as market news, economic indicators, and other technical analysis tools when making trading decisions. Remember, no pattern can predict market movements with 100% certainty.


