Understanding Trend Line Drawing Methods
Trend lines are valuable tools used by traders and investors to identify the direction of market trends and predict potential reversals. They are drawn on price charts, connecting either a series of highs or lows. This article explores the various methods of drawing trend lines and how to interpret them.
What are Trend Lines?
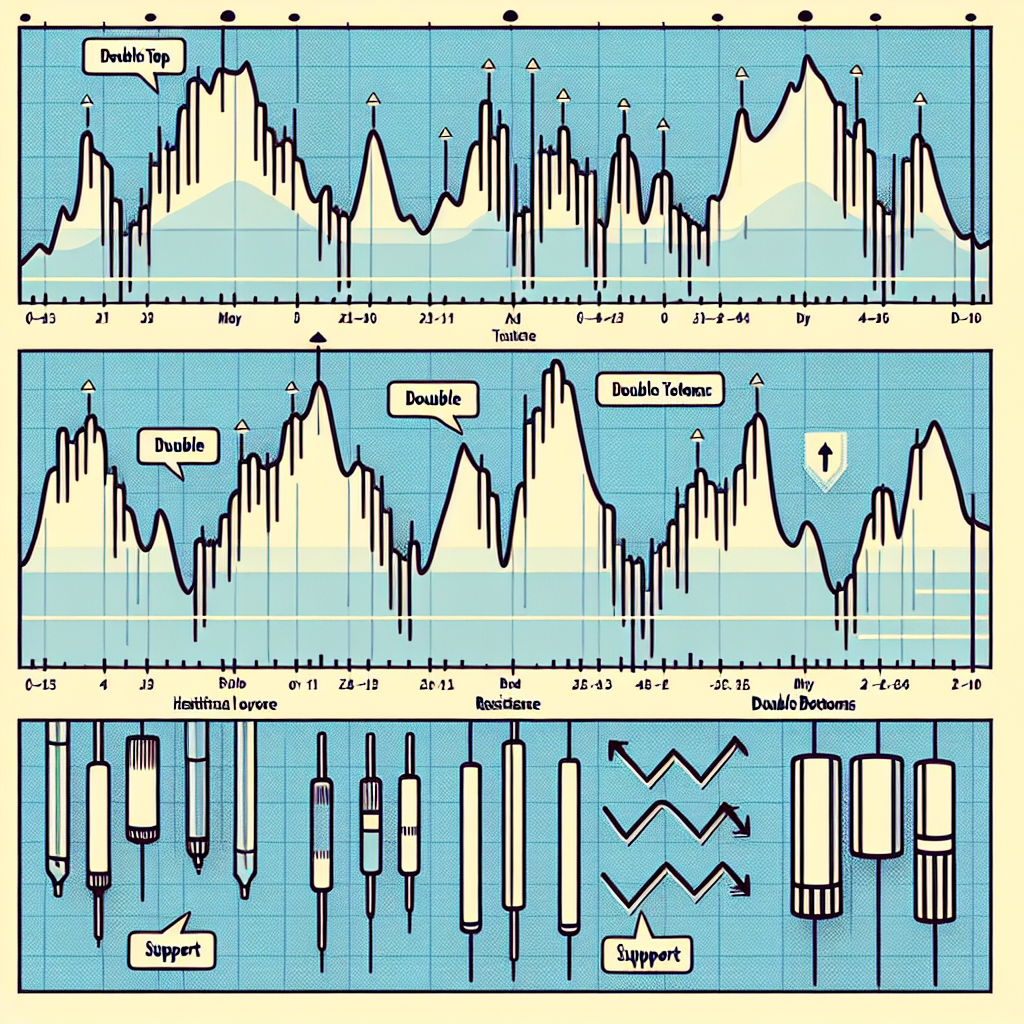
Trend lines, also known as bounding lines, are lines drawn on a price chart that connect two or more price points. Since these lines are drawn above or below the price, they indicate levels of support and resistance. Trend lines can be horizontal or sloped and are typically used to give traders a better understanding of the current market trend.
Methods of Drawing Trend Lines
There are several methods of drawing trend lines, each with its unique approach and interpretation. Here are the most common methods:
1. Traditional Method
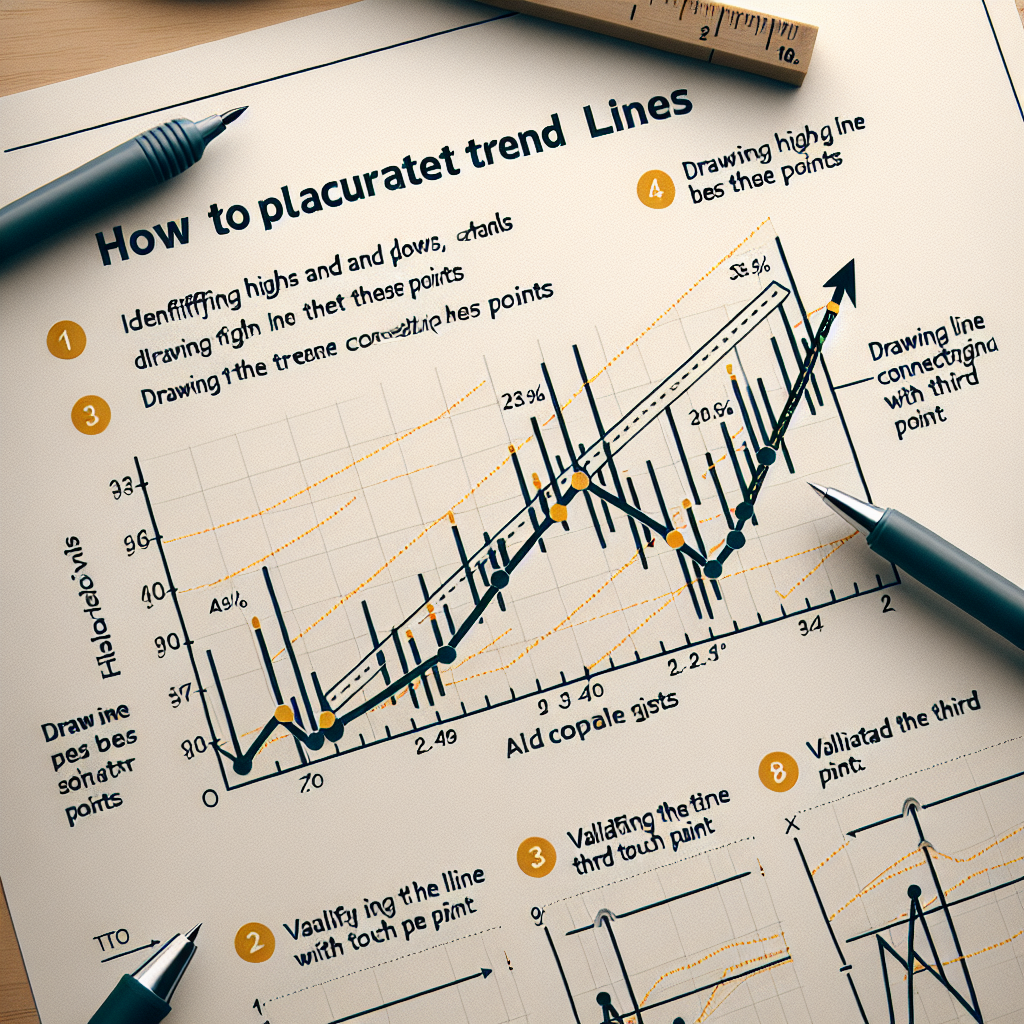
The traditional method involves drawing a line that connects at least two significant highs for a downtrend line or two significant lows for an uptrend line. The more points the line touches, the more significant the trend line becomes. This method is widely used because of its simplicity and effectiveness.
2. Using Moving Averages
Another common method is using moving averages, which smooth out price data to form a trend following indicator. Traders draw a line that follows the moving average line to identify the general price trend. This method is particularly useful in volatile markets where price swings can distort the trend line.
3. Using Trend Channels
Trend channels are a variant of trend lines where two parallel lines are drawn to represent the support and resistance levels. The upper line is drawn across the price highs, while the lower line is drawn across the price lows. This method provides a more comprehensive view of the market trend, including potential reversal points.
Interpreting Trend Lines
Interpreting trend lines can provide valuable insights into market trends. Here are some key points to consider:
1. Trend Direction
The slope of the trend line indicates the direction of the trend. An upward slope indicates an uptrend, while a downward slope indicates a downtrend. A horizontal line suggests a range-bound market.
2. Trend Strength
The number of touchpoints on the trend line can indicate the strength of the trend. The more touchpoints, the stronger the trend.
3. Trend Reversals
A break in the trend line often signals a potential trend reversal. If the price breaks above a downtrend line, it could signal the start of an uptrend, and vice versa.
Conclusion
Trend line drawing methods offer traders and investors a simple yet effective tool to analyze market trends. By understanding how to draw and interpret trend lines, one can make more informed trading decisions and potentially improve their trading performance.


