Trend Line Drawing Methods
Trading and investing are fields where data analysis plays a crucial role in decision making. One of the most common techniques used by traders and investors is trend line analysis. Trend lines are simple yet powerful tools that can help identify potential buying and selling opportunities. In this article, we will explore various trend line drawing methods.
What is a Trend Line?
A trend line, in the simplest terms, is a line that connects two or more price points and extends into the future to act as a line of support or resistance. Many of the principles applicable to support and resistance levels can be applied to trend lines as well. They are used to show the direction and speed at which a price is moving.
Types of Trend Lines
There are two main types of trend lines: uptrend lines and downtrend lines. An uptrend line has a positive slope and is formed by connecting two or more low points. The second low must be higher than the first for the line to have a positive slope. A downtrend line, on the other hand, has a negative slope and is formed by connecting two or more high points, with the second high being lower than the first.
Methods of Drawing Trend Lines
1. Manual Drawing
This is the most common method of drawing trend lines. Traders identify significant highs and lows on the price chart and then connect these points using a line. This method requires a keen eye for price patterns and a good understanding of market dynamics. While it may be subjective and vary from trader to trader, it is still the most preferred method due to its simplicity and effectiveness.
2. Using Trend Line Drawing Tools
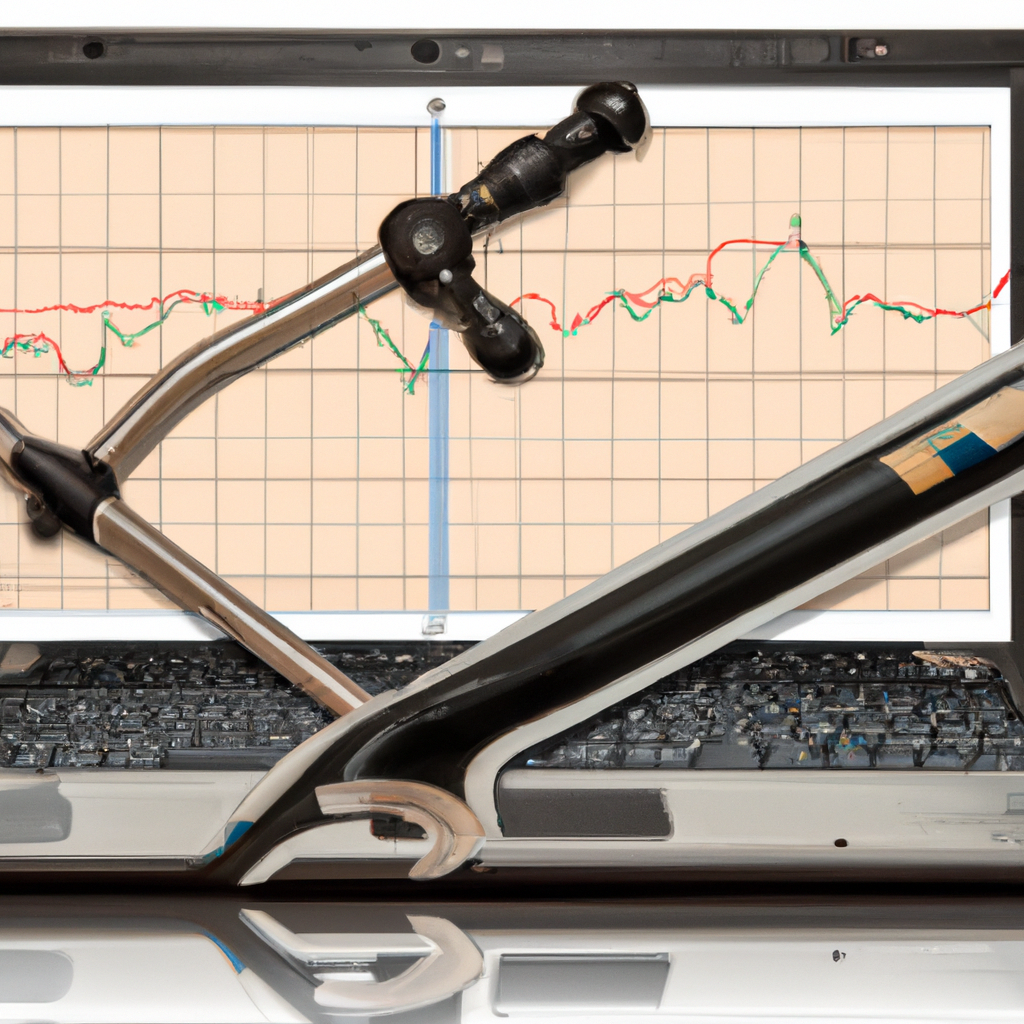
Many trading platforms and charting software offer tools that can help draw trend lines. These tools usually require the trader to identify the significant points, and the software then draws the trend line for them. This method can be more accurate as it eliminates the chance of human error.
3. Automated Trend Line Drawing
Some advanced trading software can automatically draw trend lines based on predefined criteria. These tools use complex algorithms to identify significant price points and draw trend lines. While this method can save time and effort, it may not always be accurate as market dynamics are constantly changing.
Rules for Drawing Trend Lines
Regardless of the method used, there are a few basic rules that should be followed when drawing trend lines. Firstly, it is important to remember that a trend line must connect at least two points on the price chart. Secondly, the more points a trend line connects, the stronger it is considered. Finally, a trend line is considered broken if the price closes on the other side of the trend line.
Conclusion
Trend line analysis is a powerful tool in the hands of a skilled trader. While the methods of drawing trend lines may vary, the basic principles remain the same. By identifying significant price points and connecting them, traders can gain valuable insights into market trends and potential trading opportunities.


