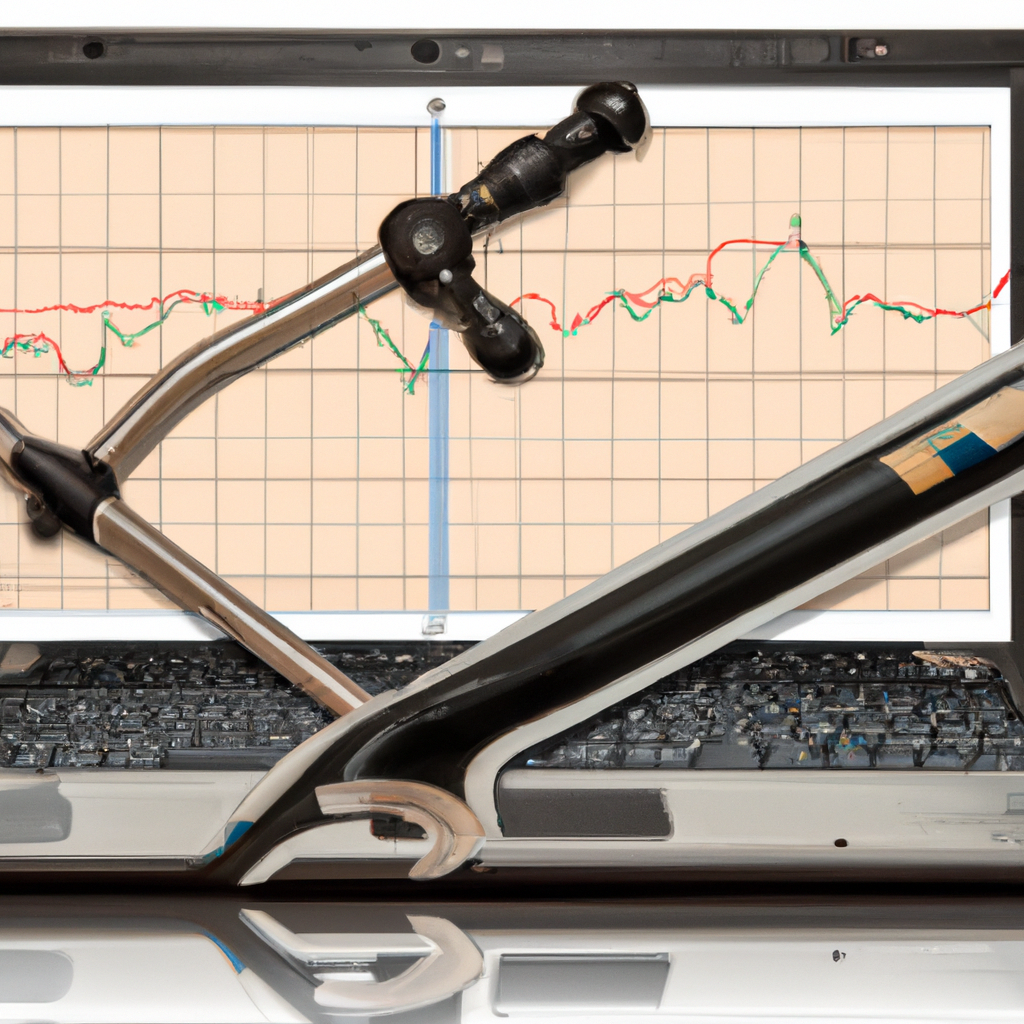
Introduction to Algorithmic Trading
Algorithmic trading, often referred to as algo trading or automated trading, is a method of executing orders using automated pre-programmed trading instructions accounting for variables such as time, price, and volume. This type of trading was developed so that investment banks, hedge funds, and pension funds could execute large trades efficiently without impacting the stock price. The efficiency, speed, and accuracy provided by algorithmic trading have made it a popular choice among traders and investors worldwide.
Understanding Technical Indicators
Technical indicators are mathematical calculations based on the price, volume, or open interest of a security or contract used by traders who follow technical analysis. By analyzing historical data, technical analysts use these indicators to predict future price movements. Examples of common technical indicators include Relative Strength Index (RSI), Moving Average Convergence Divergence (MACD), and Bollinger Bands.
The Role of Technical Indicators in Algorithmic Trading
In algorithmic trading, technical indicators play a crucial role. They serve as the foundation for the creation of trading algorithms. These indicators provide signals about when to buy or sell a particular security, which the algorithm can then act upon.
Buy and Sell Signals
For instance, if the RSI of a particular stock falls below 30, it indicates that the stock is oversold and is likely to rebound. This can be a signal to buy. Conversely, if the RSI goes above 70, it suggests that the stock is overbought and is likely to experience a price correction. This can be a signal to sell.
Signal Confirmation
Traders often use more than one technical indicator in their algorithm to confirm signals. For example, they might use the MACD in conjunction with the RSI. If both the RSI and MACD indicate that a stock is oversold, the trader might have more confidence in the buy signal.
Building an Algorithmic Trading System with Technical Indicators
The process of building an algorithmic trading system involves several steps:
1. Selecting the Technical Indicators
The first step is to decide which technical indicators to use. The choice of indicators will depend on the trader’s strategy and the type of securities they trade.
2. Defining the Trading Rules
The next step is to define the trading rules based on the technical indicators. These rules will determine when the algorithm should buy or sell.
3. Coding the Algorithm
Once the trading rules have been defined, the next step is to code the algorithm. This will require knowledge of a programming language such as Python or C++.
4. Backtesting the Algorithm
After the algorithm has been coded, it should be backtested using historical data. This will help the trader determine whether the algorithm would have been profitable in the past.
5. Implementing the Algorithm
If the backtest results are satisfactory, the final step is to implement the algorithm. This involves connecting the algorithm to a brokerage account and allowing it to execute trades.
Conclusion
Algorithmic trading with technical indicators can be a powerful tool for traders. It can help them execute trades more efficiently and accurately, and it can also help them identify trading opportunities that they might otherwise miss. However, it’s important to remember that while technical indicators can provide valuable insights, they are not infallible and should not be the sole basis for any trading decision.


