Oscillators and Momentum Indicators: A Comprehensive Guide
Introduction
In the world of trading and investing, technical analysis plays a crucial role in making informed decisions. Two key aspects of technical analysis are oscillators and momentum indicators. These tools help traders predict market trends and make investment decisions based on historical data. In this article, we will delve into what these tools are, how they work, and their significance in the trading world.
Understanding Oscillators
What are Oscillators?
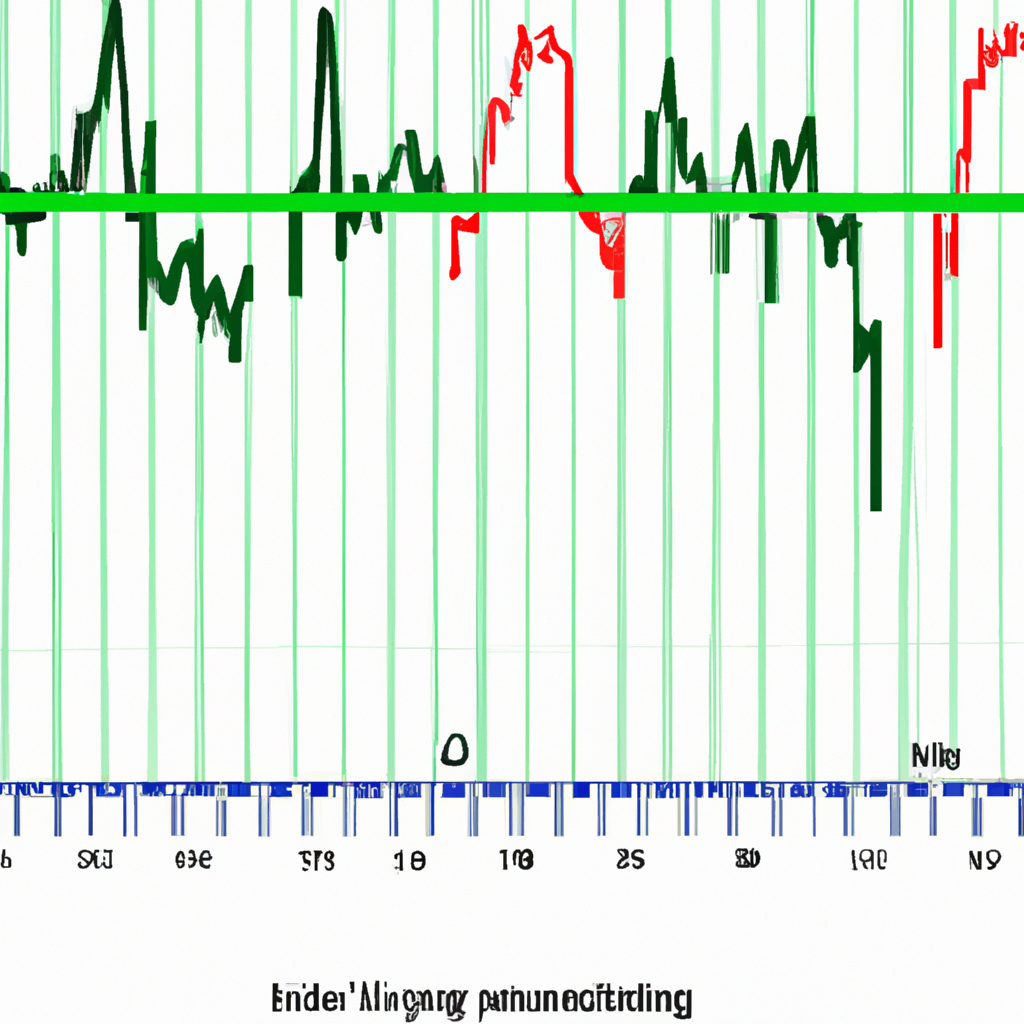
Oscillators are technical analysis tools that generate values within a predetermined range, typically between zero and 100, or -100 and 100. They are designed to help traders identify potential turning points in the market. Oscillators are most beneficial when a market is trending sideways – not up or down.
Types of Oscillators
There are several types of oscillators, each with its unique characteristics and uses. Some of the most common include the Relative Strength Index (RSI), the Stochastic Oscillator, and the Moving Average Convergence Divergence (MACD). Each of these oscillators provides different insights into market conditions, helping traders to make informed decisions.
How Oscillators Work
Oscillators work by comparing a specific market’s recent performance with its historical performance. For instance, if a market’s recent closing prices are predominantly higher than its historical average, the oscillator will move towards the higher end of its range. Conversely, if recent closing prices are mostly lower than the historical average, the oscillator will move towards the lower end of its range.
Understanding Momentum Indicators
What are Momentum Indicators?
Momentum indicators, also known as momentum oscillators, are a type of technical analysis tool used to measure the speed or velocity of price movement. In other words, they help traders identify the strength or weakness of a trend by comparing the current closing price to previous closing prices.
Types of Momentum Indicators
Several types of momentum indicators are available to traders. Some of the most popular include the Moving Average Convergence Divergence (MACD), the Relative Strength Index (RSI), and the Rate of Change (ROC). Each of these indicators offers a different perspective on market momentum and can be used to predict potential price reversals.
How Momentum Indicators Work
Momentum indicators work by comparing the current price of a security to its past prices. If the current price is significantly higher than past prices, the momentum is considered positive. Conversely, if the current price is significantly lower than past prices, the momentum is considered negative. Traders use these indicators to identify potential price reversals and to confirm the strength of a trend.
Conclusion
Both oscillators and momentum indicators are essential tools in technical analysis. They provide valuable insights into market conditions, helping traders make informed decisions. While they can be extremely useful, it’s important to remember that no technical analysis tool is infallible. Therefore, they should be used in conjunction with other forms of analysis to maximize their effectiveness.


