Introduction to Double Tops and Bottoms
Double tops and double bottoms are among the most popular and reliable chart patterns used by traders and investors to predict the reversal of a current trend. A double top signals a potential bearish reversal after an uptrend, while a double bottom suggests a bullish reversal following a downtrend. Recognizing these patterns early can be crucial for making informed trading decisions.
Understanding Double Tops
Formation of a Double Top
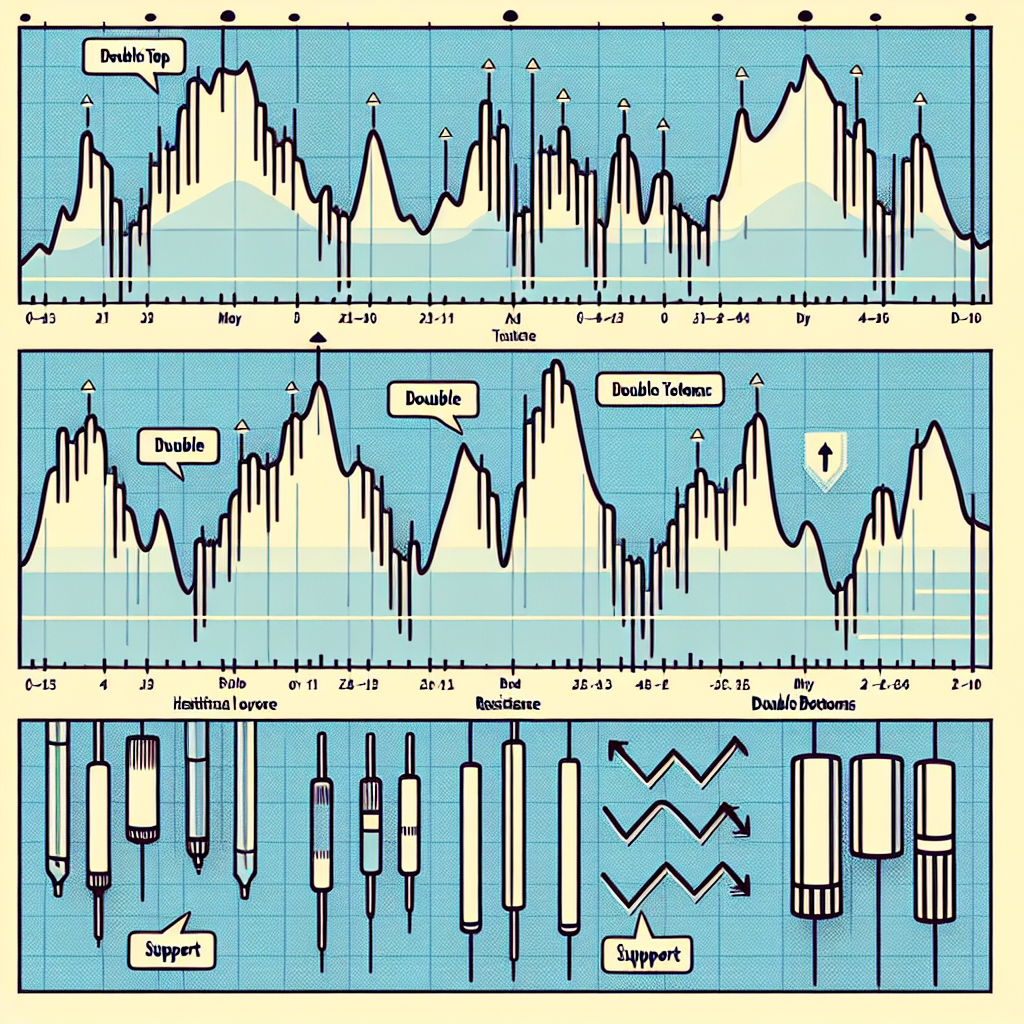
A double top pattern is formed when the price of an asset reaches a high point, undergoes a minor pullback, rises back to the same high point, and then declines again. The pattern is characterized by two peak points that are approximately on the same level, forming an “M” shape on the chart.
Trading a Double Top
When identifying a double top, traders often wait for the price to break below the neckline—the support level connecting the low point between the two highs—before considering a sell. The breakout below the neckline confirms the pattern, suggesting that the price may continue to decline.
Understanding Double Bottoms
Formation of a Double Bottom
A double bottom pattern, conversely, occurs when the price drops to a support level, rebounds, falls back to the support level again without breaking below it, and finally starts an upward trend. This pattern resembles a “W” on the chart.
Trading a Double Bottom
For double bottoms, the critical moment comes when the price breaks above the resistance level—the neckline formed by the high between the two lows. A break above this level confirms the double bottom pattern and suggests the start of an uptrend.
Key Indicators to Confirm the Patterns
Volume Analysis
Volume plays a vital role in confirming the validity of double tops and bottoms. In a double top scenario, volume tends to be higher on the first peak than on the second. Conversely, in a double bottom, volume might increase as the pattern completes, indicating growing buying pressure.
Confirmation with Oscillators
Using oscillators like the Relative Strength Index (RSI) or the Moving Average Convergence Divergence (MACD) can help confirm reversals suggested by double tops and bottoms. Divergences between these indicators and price movements can provide additional confirmation signals.
Common Mistakes and Tips for Trading Double Tops and Bottoms
Avoid Trading Without Confirmation
One common mistake is entering a trade before the pattern is fully confirmed. Waiting for a clear breakout beyond the neckline can minimize the risk of false signals.
Setting Proper Stop-Losses
To manage risk effectively, setting stop-loss orders just above the neckline for double tops or below the neckline for double bottoms can help protect against sudden reversals in the opposite direction.
Conclusion
While double tops and bottoms can provide valuable signals for trend reversals, traders should use them in conjunction with other technical analysis tools and indicators to improve their accuracy. Through practice and careful analysis, traders can enhance their ability to recognize and capitalize on these patterns, ultimately leading to more informed trading decisions.


