Introduction to Trend Lines
Trend lines are crucial tools in technical analysis, allowing traders and investors to visually capture the market’s direction by connecting a series of price points on a chart. However, drawing accurate trend lines isn’t just about connecting highs or lows; it involves understanding market psychology, recognizing significant points, and applying consistent rules.
Understanding the Basics of Trend Lines
Trend lines can be classified into two main types: uptrend lines and downtrend lines. An uptrend line connects the higher lows in a rising market, indicating support levels where buyers consistently overcome sellers. Conversely, a downtrend line connects lower highs, pinpointing resistance levels where sellers overpower buyers. The correct identification and drawing of these lines can forecast potential market movements and are thus invaluable in trading strategy.
Step 1: Identify the Trend
Determining the Market Direction
The first step to drawing an accurate trend line is identifying the overall direction of the market. Is it in an uptrend, downtrend, or moving sideways? This initial analysis will dictate how you will apply trend lines to your analysis.
Step 2: Select Significant Points
Choosing Swing Highs and Lows
For an uptrend, select the significant lows (swing points) where the price bounced upwards. For a downtrend, focus on the significant highs where the price faced resistance and fell. These points are not arbitrary; they represent moments where market sentiment shifted, making them foundational for drawing trend lines.
Step 3: Draw the Line
Connecting Points Correctly
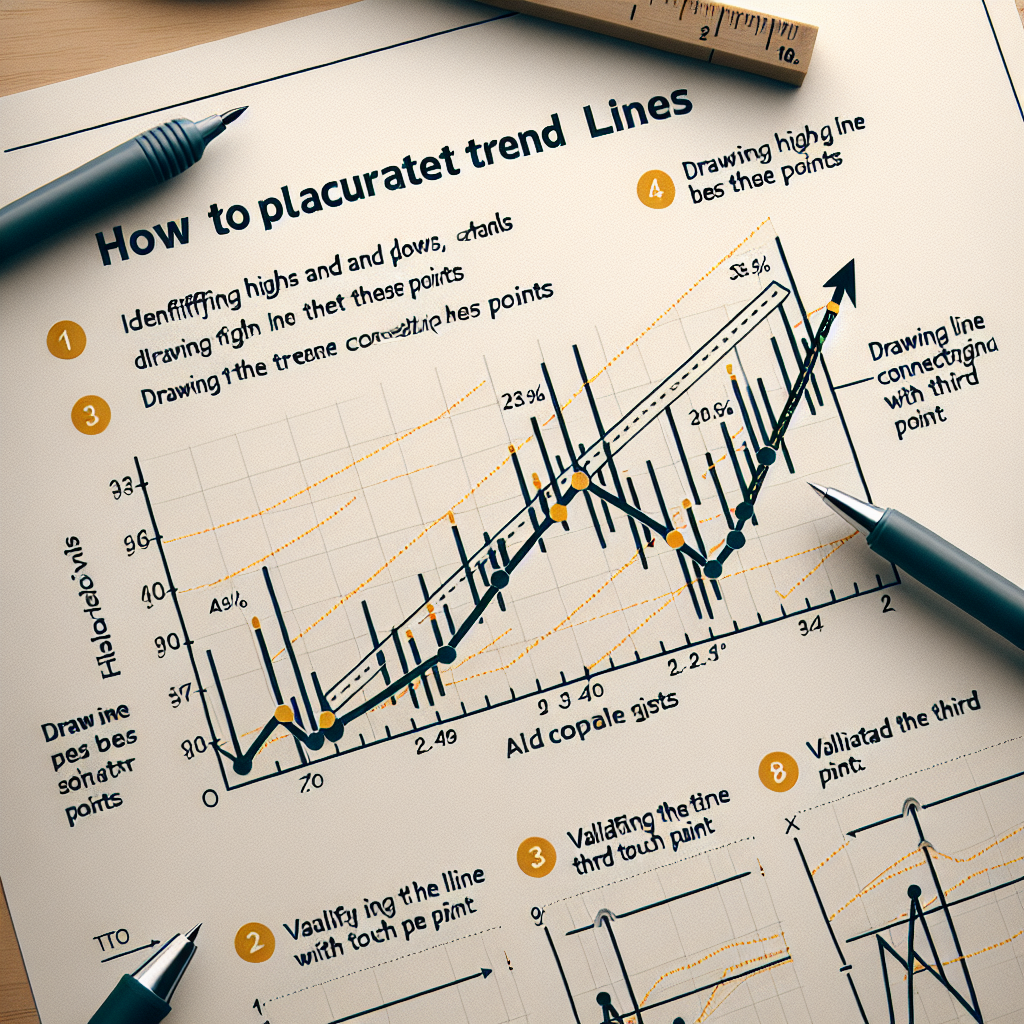
Now, connect at least two of the most recent significant points. For a line to be valid, it should touch at least three points. The more points it touches without breaking, the stronger and more significant the trend line becomes. Use a ruler or a drawing tool for straight lines. It’s crucial not always to force the line to fit the narrative you want to see. Let the data guide you.
Step 4: Validate the Trend Line
Confirming the Line’s Significance
Validation comes from observing the price action following the drawing of your trend line. A valid trend line will act as resistance or support, experiencing multiple touches. Watch for breakouts or bounces as confirmation that your trend line accurately represents market sentiment.
Practical Tips for Drawing Trend Lines
Common Mistakes To Avoid
One of the common mistakes in drawing trend lines is cherry-picking points to support a preconceived notion about market direction. Ensure your lines are based on significant and objectively chosen points. Another mistake is relying solely on trend lines for trading decisions. Always corroborate with other indicators and analysis methods for a comprehensive view.
Conclusion
Drawing accurate trend lines is a skill that improves with practice and patience. By following these structured steps and tips, you can enhance your technical analysis and make more informed trading decisions. Remember, no tool in the financial market is infallible, but accurate trend lines can significantly improve your market analysis and prediction accuracy.