Recognizing Double Tops and Bottoms in Trading
Trading in the financial markets involves a significant level of risk. However, understanding and interpreting chart patterns can provide traders with an upper hand in predicting potential price movements. Two of these chart patterns that are highly regarded by traders are the Double Top and Double Bottom. In this article, we will discuss how to recognize these patterns and how they can be used in trading.
What are Double Tops and Bottoms?
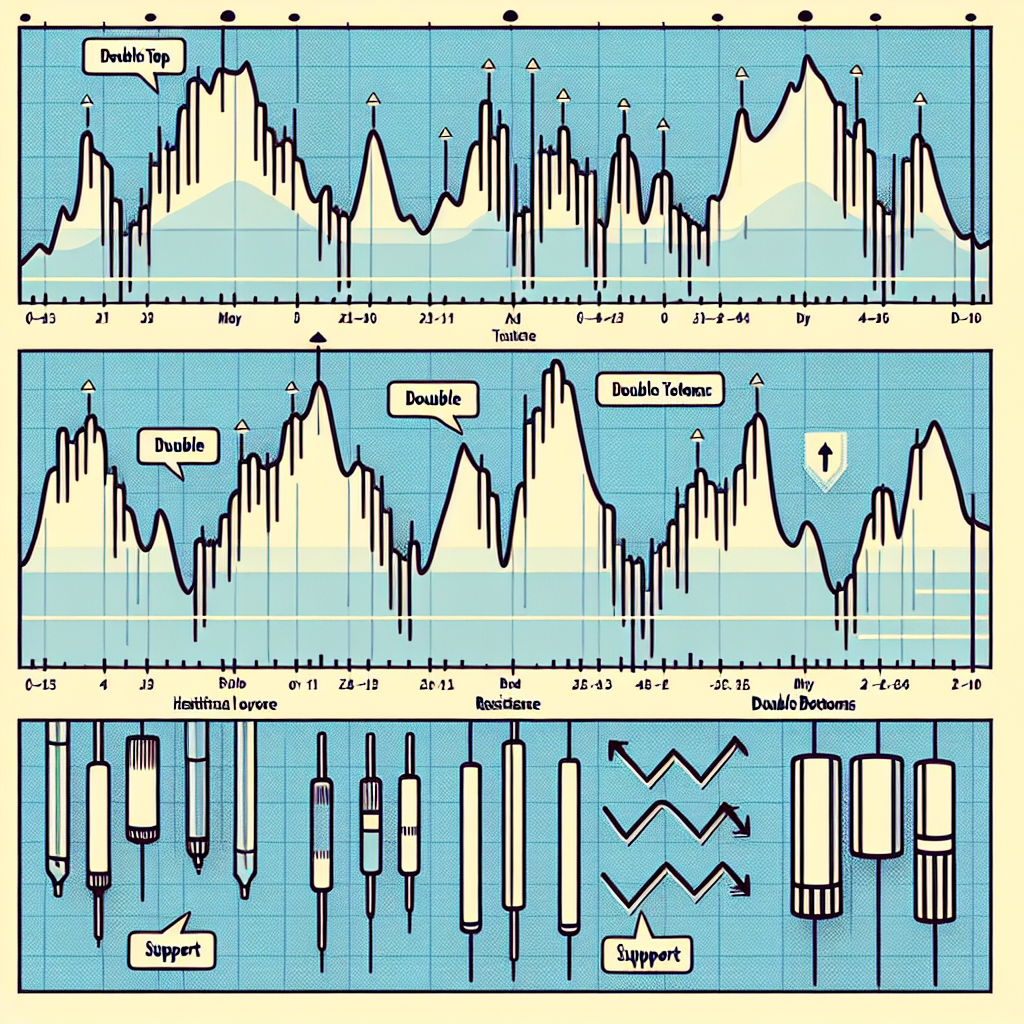
Double Tops and Bottoms are reversal patterns that occur when the price of an asset hits the same high or low point twice without breaking through. This pattern is often seen as an indicator that the current trend is about to reverse, providing an opportunity for traders to enter or exit the market accordingly.
Double Top
A Double Top is a bearish reversal pattern that forms after an uptrend. It is characterized by two consecutive peaks that are roughly equal, with a moderate trough in-between. This pattern indicates that the price is unable to break through a certain high point, suggesting that the bulls are losing control to the bears.
Double Bottom
Conversely, a Double Bottom is a bullish reversal pattern that forms after a downtrend. It features two consecutive troughs that are approximately equal, with a moderate peak in-between. This pattern suggests that the price is unable to break through a certain low point, indicating that the bears are losing control to the bulls.
How to Recognize Double Tops and Bottoms
Recognizing these patterns involves looking for specific characteristics on a price chart. Here’s what to look for:
Identifying a Double Top
1. First Peak: After an uptrend, the price reaches a high point and then declines.
2. Trough: The price then rises again but fails to reach the previous high, forming a trough.
3. Second Peak: The price falls again, forming a second peak roughly equal to the first.
4. Break: Confirmation of the pattern occurs when the price falls below the support level (the low point of the trough).
Identifying a Double Bottom
1. First Trough: After a downtrend, the price reaches a low point and then rises.
2. Peak: The price then falls again but fails to reach the previous low, forming a peak.
3. Second Trough: The price rises again, forming a second trough roughly equal to the first.
4. Break: Confirmation of the pattern occurs when the price rises above the resistance level (the high point of the peak).
Conclusion
Double Tops and Bottoms are powerful trading tools that can help traders predict potential reversals in the market. However, like all trading strategies, they should be used in conjunction with other tools and indicators to increase their effectiveness. Always remember to practice risk management and never risk more than you are willing to lose.


