Introduction to Price Action Trading Techniques
Trading in the financial markets involves a variety of strategies. Among them, price action trading is one that focuses on the analysis of pure price movements. Unlike other methods that rely on technical indicators, price action trading techniques are based on the raw price data of a market. This article will delve into the various price action trading techniques that traders can use to improve their trading strategy.
Understanding Price Action Trading
Before we delve into the specific techniques, it’s crucial to understand what price action trading entails. Price action trading is a form of technical analysis that focuses on past prices to predict future price movements. Traders who use this strategy believe that all market information is reflected in the price, making it unnecessary to use other indicators.
Importance of Price Action Trading
Price action trading is widely used because of its simplicity and effectiveness. It allows traders to read the market and make subjective trading decisions based on the recent and actual price movements, rather than relying solely on technical indicators.
Price Action Trading Techniques
There are several price action trading techniques that traders can use. Here are the most common ones:
1. Support and Resistance Levels
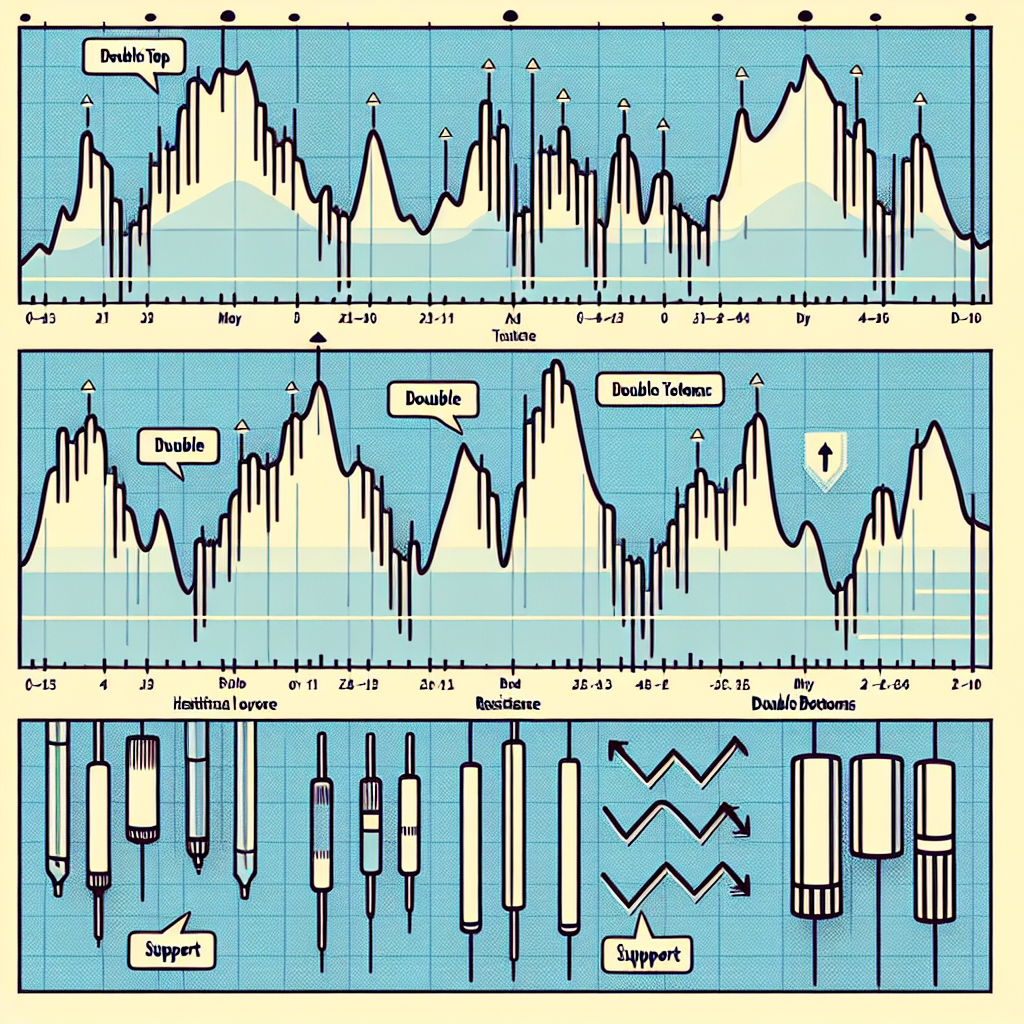
Support and resistance levels are horizontal price levels that temporarily halt or reverse the continuous price movement. The support level refers to the price level where the market tends to rise, while the resistance level is where the market tends to fall. Traders often buy at support and sell at resistance.
2. Trend Lines
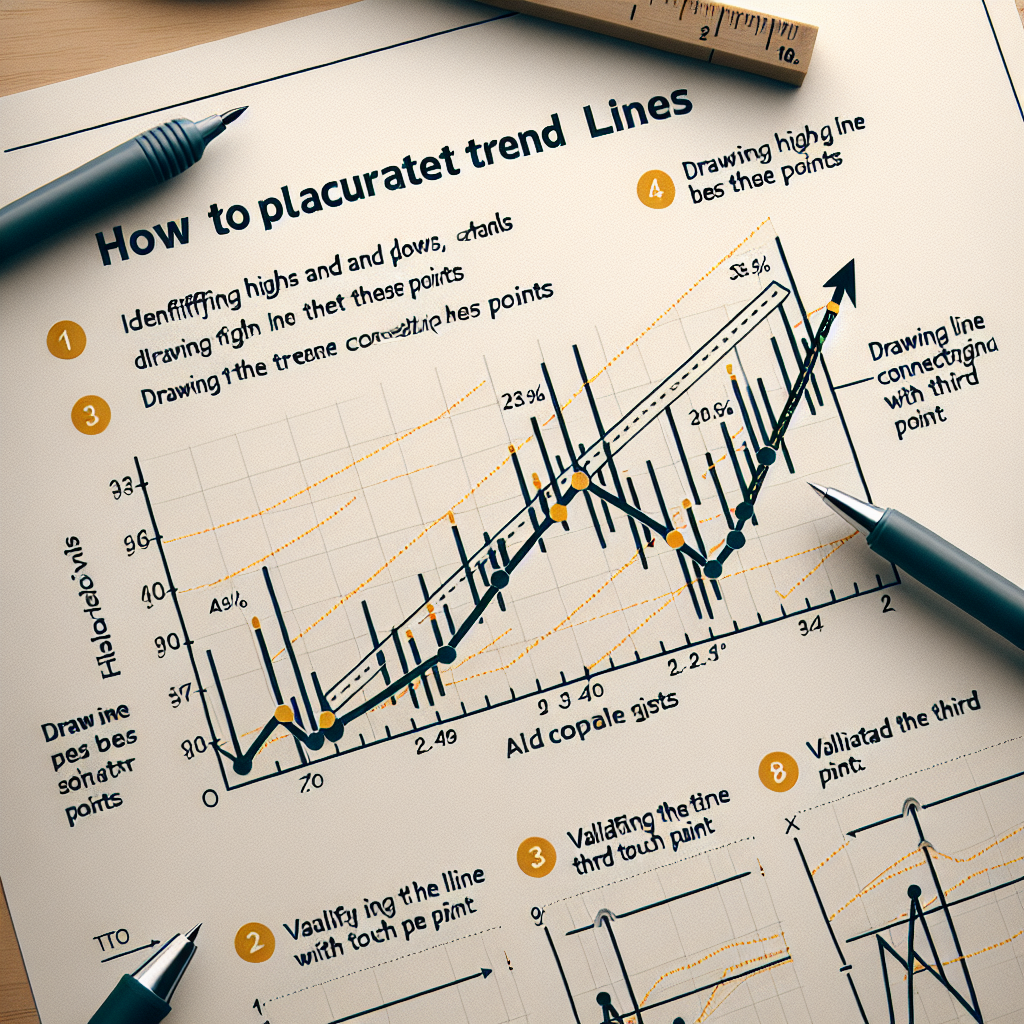
Trend lines are diagonal lines drawn above or below the price, representing the trend direction. They serve as potential support and resistance levels. A trend line is valid if it’s touched by price three times or more.
3. Candlestick Patterns
Candlestick patterns are specific patterns that the price forms over a certain period. They provide visual insights into market psychology and can help traders predict future price movements. Examples of candlestick patterns include the hammer, engulfing, and doji.
4. Chart Patterns
Chart patterns are price formations represented in a graphical way. They are often used to confirm the continuation or reversal of a trend. Common chart patterns include the head and shoulders, double top and bottom, and triangles.
Conclusion
Price action trading techniques provide valuable insights into market dynamics and can help traders make more informed decisions. By understanding and applying these techniques, traders can enhance their ability to predict future price movements and improve their overall trading strategy. However, like any other trading strategy, price action trading is not foolproof and should be used in conjunction with other tools and techniques to manage risk effectively.


