Introduction to Elliott Wave Analysis Methods
The Elliott Wave Principle is a form of technical analysis that traders use to analyze market cycles and forecast market trends by identifying extremes in investor psychology, highs and lows in prices, and other collective factors. Developed by Ralph Nelson Elliott in the 1930s, this principle is based on the theory that markets move in repetitive cycles, which he attributed to the mass psychology of investors that tends to swing from pessimism to optimism and back. This article delves into the fundamental aspects of Elliott Wave Analysis methods.
Basic Principles of Elliott Wave Analysis
Elliott Wave Analysis is constructed from three basic tenets. These are:
The Wave Principle
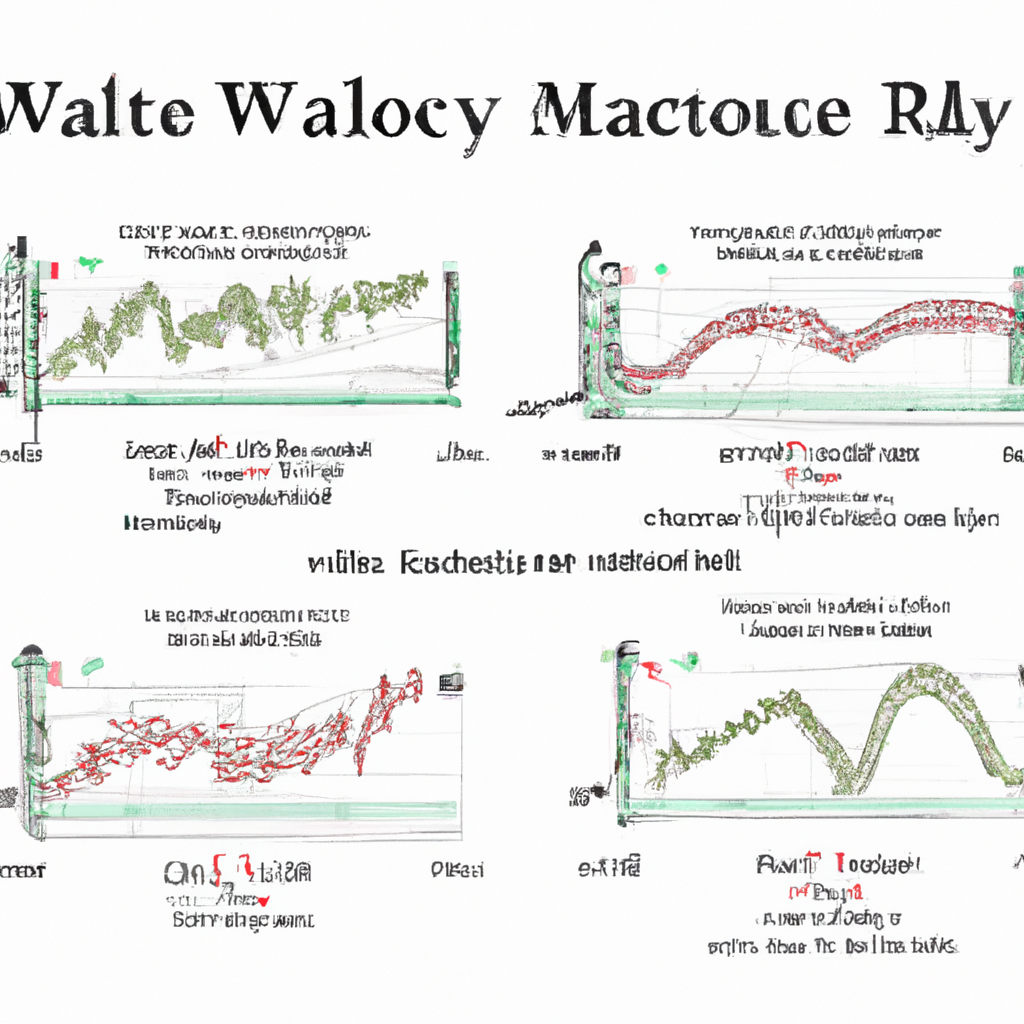
According to Elliott, the market price action unfolds in specific patterns, or “waves,” which are fractal in nature. This means the same patterns are found in every time frame, from a one-minute chart to a yearly chart.
Impulse and Corrective Waves
Elliott divided these wave patterns into two major types: impulse waves and corrective waves. Impulse waves consist of five smaller waves and move in the same direction as the trend of the next larger size. Corrective waves, on the other hand, consist of three smaller waves and move against the trend of the next larger size.
Wave Degree
Elliott identified nine degrees of waves, from the smallest to the largest: Subminuette, Minuette, Minute, Minor, Intermediate, Primary, Cycle, Supercycle, and Grand Supercycle. Each degree of a wave serves the function of building the pattern of the next larger degree.
Applying Elliott Wave Analysis
To apply Elliott Wave Analysis, traders typically follow these steps:
Identify the Wave Count
The first step in applying Elliott Wave Analysis is to identify the wave count. This involves identifying a significant peak and trough and then counting the wave patterns that occur between these two points.
Determine the Underlying Trend
Once the wave count has been identified, the next step is to determine the underlying trend. This is done by observing the direction of the impulse waves within the wave count.
Forecast Price Targets
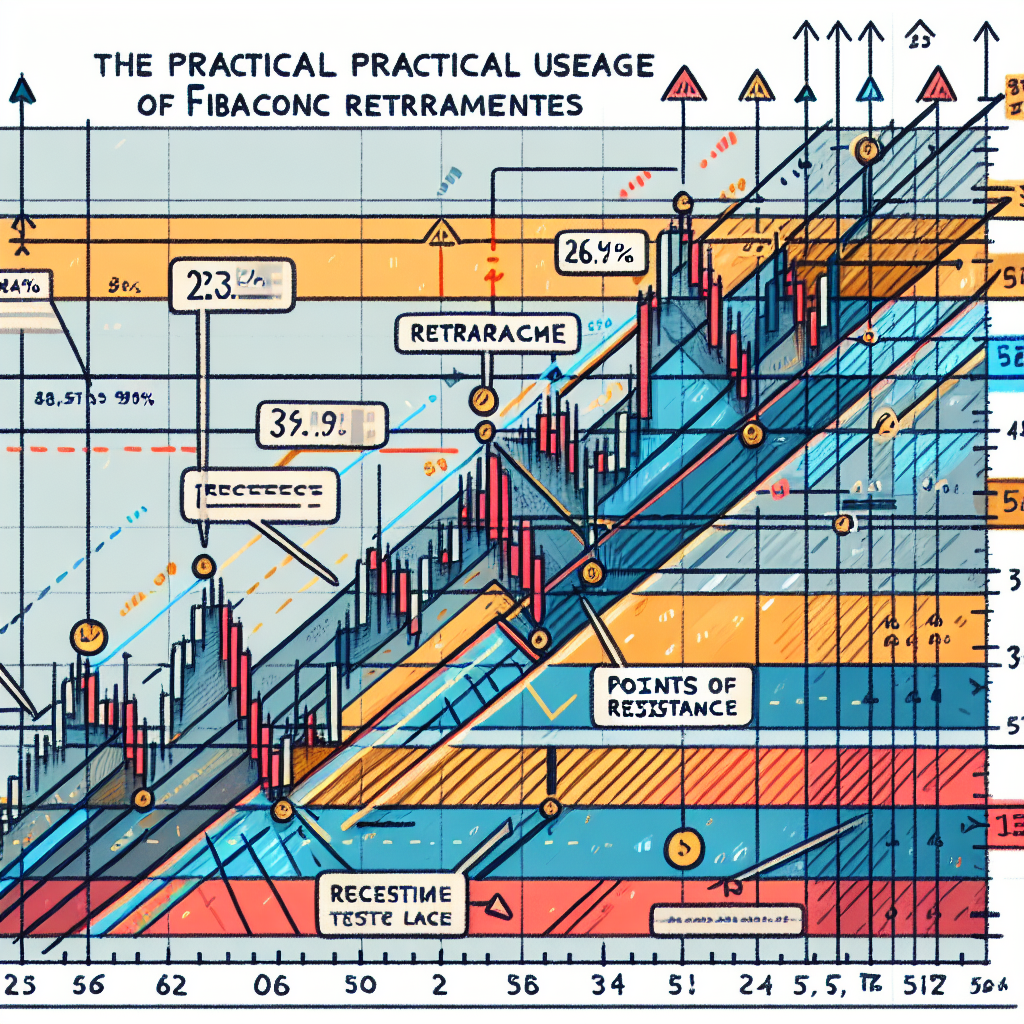
After the underlying trend has been identified, the next step is to forecast price targets. This can be done by using Fibonacci ratios, which are often used in conjunction with Elliott Wave Analysis.
Limitations of Elliott Wave Analysis
While Elliott Wave Analysis can be a powerful tool, it also has its limitations. It is subjective, and different analysts might interpret the same wave patterns differently. It also requires a good deal of practice and experience to master. Despite these limitations, many traders find it a valuable part of their trading arsenal.
Conclusion
Elliott Wave Analysis provides a comprehensive and detailed method of analyzing market cycles and forecasting market trends. By understanding the basic principles and learning how to apply them, traders can gain a deeper understanding of market psychology and make more informed trading decisions. However, like any trading method, it requires practice and experience to use effectively.


