Recognizing Double Tops and Bottoms in Trading
In the world of trading, understanding chart patterns is crucial for predicting future price movements. Among the most common and reliable chart patterns are the double tops and bottoms. This article will delve into understanding these patterns and how to recognize them effectively.
What are Double Tops and Bottoms?
Before we dive into recognizing these patterns, it’s important to understand what they are.
Double Tops
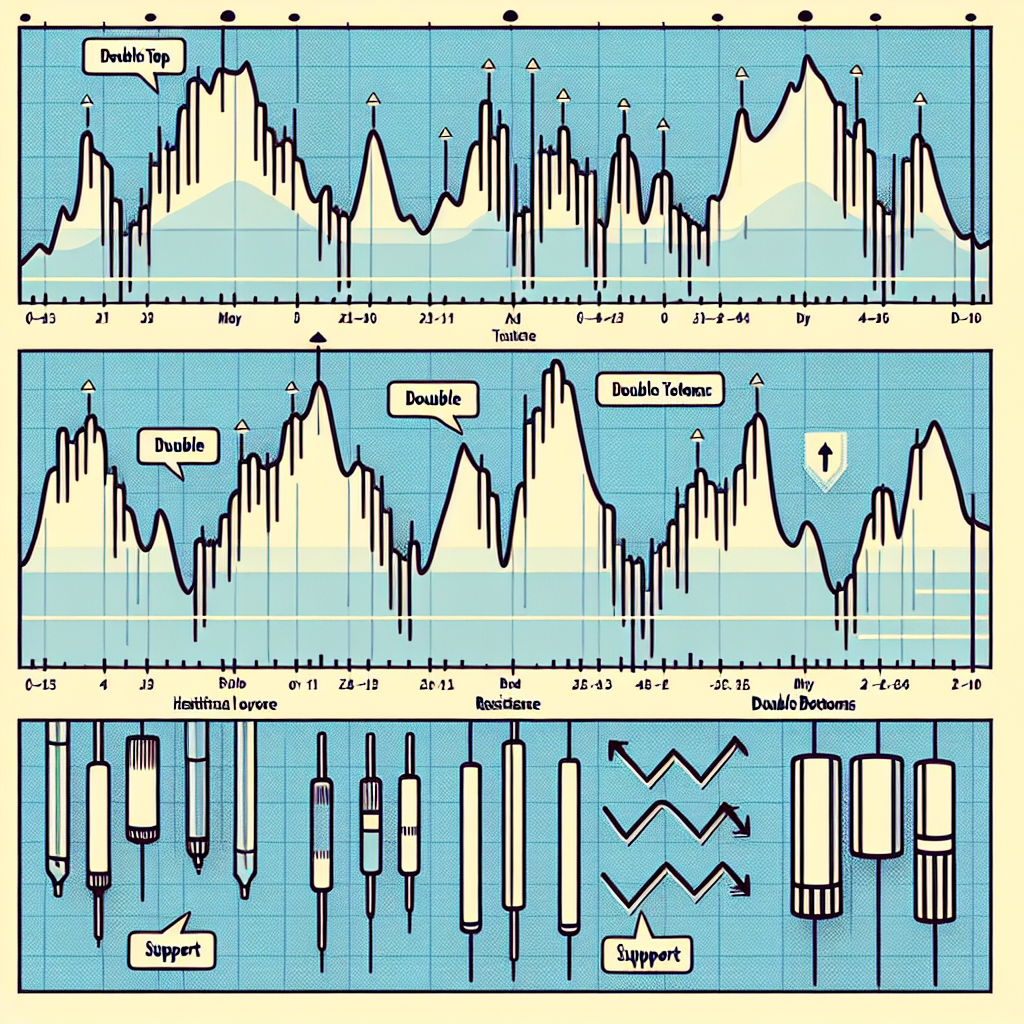
A double top is a reversal pattern that is formed after there is a significant move upwards. It’s characterized by two consecutive peaks that are roughly at the same price level. This pattern is a clear signal that the market could be switching from a bullish (upward) trend to a bearish (downward) trend.
Double Bottoms
Conversely, a double bottom is a reversal pattern that forms after a significant move downwards. It’s marked by two consecutive troughs that are roughly at the same price level. This pattern indicates that the market could be shifting from a bearish trend to a bullish trend.
Recognizing Double Tops
Recognizing a double top pattern involves several steps.
Step 1: Uptrend
The first step is identifying an uptrend. This is a period where the prices are generally increasing.
Step 2: First Peak
The next step is identifying the first peak, which is the highest point of the uptrend.
Step 3: Price Decline
After the first peak, there should be a price decline. This is a period where the prices are generally decreasing.
Step 4: Second Peak
The fourth step is identifying the second peak. This peak should be approximately at the same level as the first peak.
Step 5: Price Decline
The final step is another price decline. If the price breaks below the previous low between the two peaks, it confirms the double top pattern.
Recognizing Double Bottoms
Recognizing a double bottom pattern also involves several steps.
Step 1: Downtrend
The first step is identifying a downtrend. This is a period where the prices are generally decreasing.
Step 2: First Trough
The next step is identifying the first trough, which is the lowest point of the downtrend.
Step 3: Price Increase
After the first trough, there should be a price increase. This is a period where the prices are generally increasing.
Step 4: Second Trough
The fourth step is identifying the second trough. This trough should be approximately at the same level as the first trough.
Step 5: Price Increase
The final step is another price increase. If the price breaks above the previous high between the two troughs, it confirms the double bottom pattern.
Conclusion
Recognizing double tops and bottoms can be a powerful tool in predicting future price movements. However, like all trading strategies, it’s not foolproof. It’s important to use these patterns along with other indicators to make the most informed trading decisions.


