Introduction to Harmonic Patterns
Trading in the financial market involves a lot of strategies and techniques, one of which is using harmonic patterns. Harmonic patterns are precise geometric price structures that are based on Fibonacci numbers and the golden ratio. They are used to identify potential reversals in the market, allowing traders to catch high probability, low risk trade setups.
The Origin of Harmonic Patterns
Harmonic trading patterns were discovered by H.M. Gartley in 1932. In his book, “Profits in the Stock Market,” Gartley described a specific chart pattern, or formation, that he called the “Gartley 222.” This pattern later became the basic foundation for harmonic trading. Over time, other traders like Larry Pesavento, Scott Carney, and others expanded on Gartley’s idea, introducing other harmonic patterns like the Butterfly, Bat, Crab, and Shark.
Common Types of Harmonic Patterns
The Gartley Pattern
The Gartley pattern, also known as the “Gartley 222,” is a bullish or bearish reversal pattern that consists of four legs marked X-A, A-B, B-C, and C-D. It is used to predict where the price will go after it completes the final leg.
The Butterfly Pattern
The Butterfly pattern is similar to the Gartley pattern but with a longer XA leg. It is a reversal pattern that can appear at the end of a trend (either uptrend or downtrend) and signals a potential price reversal.
The Bat Pattern
The Bat pattern is a variation of the Gartley pattern, but with different Fibonacci measurements for each point. It is also a reversal pattern that can signal the potential change in the price direction.
The Crab Pattern
The Crab pattern is another variation of the Gartley pattern and is considered the most accurate among the harmonic patterns. It has a high risk/reward ratio because of its potential for larger price reversals.
Trading with Harmonic Patterns
Trading with harmonic patterns involves identifying these patterns on the chart and using them to predict future price movements. Here are the basic steps involved:
Step 1: Identify a Potential Harmonic Pattern
The first step in trading with harmonic patterns is to identify a potential pattern on the chart. This involves looking for the specific price movements that form the pattern.
Step 2: Measure the Pattern
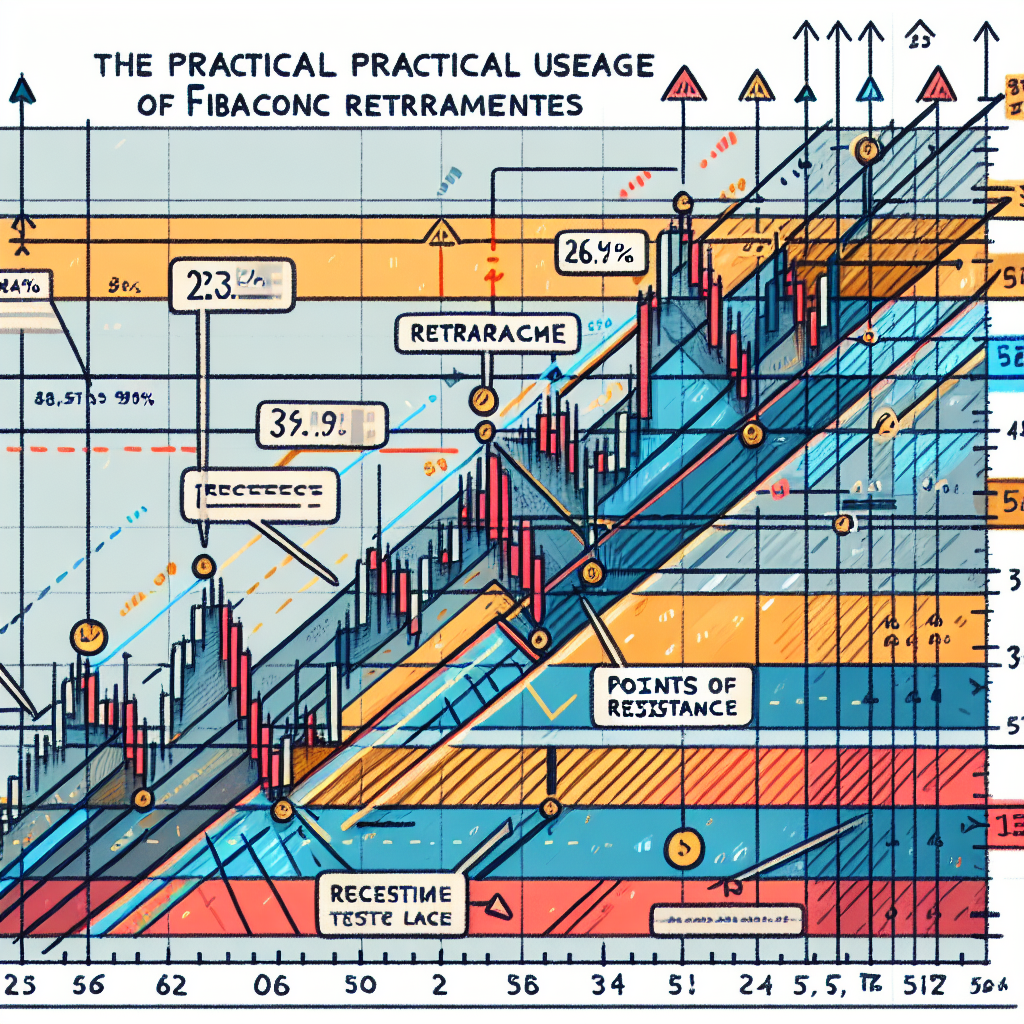
Once you’ve identified a potential pattern, the next step is to measure it using Fibonacci retracement and extension tools. This will help you determine the potential reversal points in the pattern.
Step 3: Wait for Confirmation
After measuring the pattern, you need to wait for confirmation before entering a trade. This usually involves waiting for the price to reach the potential reversal point and then looking for a confirmation signal such as a candlestick pattern or a reversal signal from a technical indicator.
Step 4: Enter the Trade
Once you’ve got confirmation, you can enter the trade. Your stop loss should be placed just beyond the potential reversal point, and your take profit should be set based on the Fibonacci measurements of the pattern.
Conclusion
Harmonic patterns are a powerful tool in the hands of a skilled trader. They provide high probability trade setups with clearly defined risk and reward parameters. However, like all trading strategies, they require practice and experience to use effectively. Always remember to use proper risk management and never risk more than you can afford to lose.


