Drawing Accurate Trend Lines
Drawing accurate trend lines is a fundamental aspect of technical analysis in trading. Trend lines help traders identify market trends and make informed trading decisions. This article will walk you through the steps to draw accurate trend lines.
What are Trend Lines?
Trend lines, also known as bounding lines, are straight lines that connect a series of successive peaks or troughs on a price chart. They are used to identify and confirm existing market trends, either bullish (upward) or bearish (downward). When the price stays above the trend line, it indicates an upward trend, and when it stays below, it indicates a downward trend.
Steps to Draw Accurate Trend Lines
Step 1: Identify the Trend
The first step in drawing a trend line is to identify the direction of the current market trend. This can be upward, downward, or sideways. An upward trend is characterized by higher highs and higher lows, while a downward trend is characterized by lower highs and lower lows.
Step 2: Locate the Peaks and Troughs
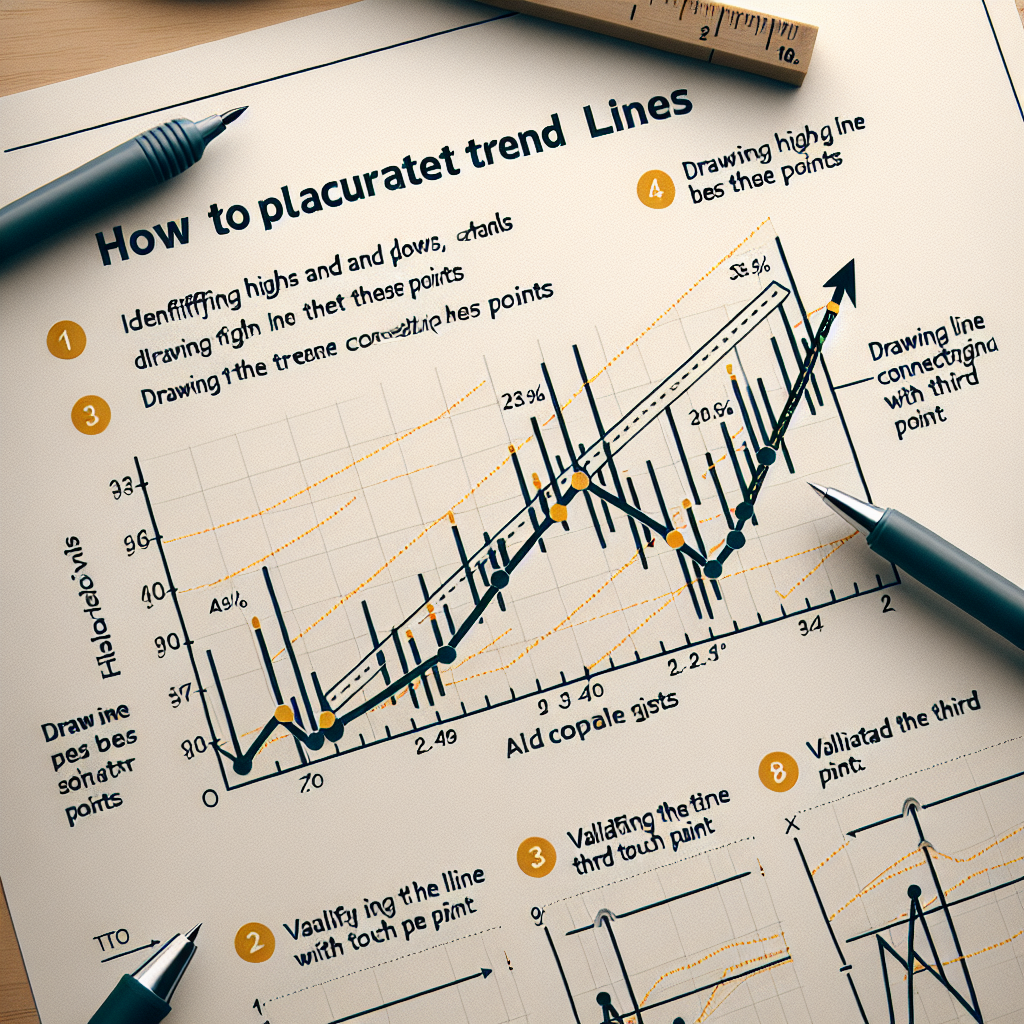
After identifying the trend, the next step is to locate the peaks (high points) and troughs (low points) on the price chart. For an upward trend, you will connect the successive higher lows, and for a downward trend, you will connect the successive lower highs.
Step 3: Draw the Trend Line
Using a straight line tool available in most charting software, connect at least two of the most recent lows for an upward trend or highs for a downward trend. The line should be extended out to the right to provide a guideline for future price action.
Step 4: Validate the Trend Line
A valid trend line should be touched or nearly touched by the price at least three times. The more times the price touches the trend line without breaking it, the more valid it is considered.
Common Mistakes in Drawing Trend Lines
Mistake 1: Drawing Overly Steep Trend Lines
Traders often make the mistake of drawing overly steep trend lines that are not sustainable. A trend line should realistically represent the trend.
Mistake 2: Overfitting the Trend Line
Overfitting happens when a trader tries to force the trend line to fit the market by drawing it through the price action rather than beneath or above it. This can lead to inaccurate interpretations of the trend.
Mistake 3: Ignoring Long-Term Trends
While short-term trends are important, it’s crucial not to ignore the bigger picture. Long-term trend lines can provide valuable context and help identify potential reversals.
Conclusion
Drawing accurate trend lines is a skill that takes practice to master. By following these steps and avoiding common mistakes, traders can improve their ability to identify market trends and make more informed trading decisions. Remember, while trend lines are a useful tool, they should be used in conjunction with other technical analysis tools for the best results.


